Australian (ASX) Stock Market Forum

Gold Price - Where is it heading?

Maybe you should just own IOZ and GDX?
not me , i like to cherry-pick , and that is just the gold/copper stocks , but you have to be patient ( and willing to see some companies fail on the way ) while my gold stocks have been a mixed bag , my computer ( services ) companies have been great ( most are multi-baggers )
 
Good question. I've been thinning recently. Gone from owning 30 stocks to about 20. @divs4ever seems to own about 1000.
something over 200 last i counted them but current take-over offers might bring that rather close to 200 . but i have an assortment of mid-caps , small caps and some micro-caps , not so many large caps ( top 50 )

at the end of the year ( 2023 )

the top holdings looked like this

and at the end of the year after some selling to invest off-market

( by $value )

1. CMW ( at full cash risk )

2. PME ( 'free-carried ' ) ( about $600 behind )

3 .MQG ( 'free-carried ' ) ( less than $100 behind )

4. BHP ( some profit taken ) ( about $100 behind )

5. WES ( some profit taken )

6. APE ( ' free-carried' )

( cash )

7. CUP ( at full cash risk )

8. REP ( at full cash risk )

9. KGN ( at reduced cash risk ) ( less than $100 behind )

10. CDM ( at full cash risk ) ( about $300 behind )

close behind is CAM ( at full cash risk ) SGLLV ( at full cash risk ) , and QVE ( at full cash risk )

i am not going to update the list until the end of march ( or maybe June )

some of those rankings will have changed and a fair bit of the cash went into off-market purchases

like KGN zoomed past APE
 
The market seems to think a correction is around the corner, based on all of my gold stocks bar ALK and TCQ having down days.
Mick

Yep, gold equities still in the toilet. The risk with holding the stocks is that if the general market corrects the stocks will too. And the general market might just correct when the FANGS etc crash back to reality. Frustrating.
 
Good evening

Gold futures to end 2024 at $US2300: CBA

Lower US bond yields and a weaker greenback explain part of the 6 per cent rally in gold futures in February, said Vivek Dhar, Commonwealth Bank mining and energy commodities strategist.

“Other factors, such as safe-haven demand and even Chinese physical demand, have likely played a role,” he said. Gold futures topped above $US2180/oz. But he cautioned that history has shown that any increase is bound to be short-lived.

If the conflict in the Middle East continues with little change, Mr Dhar said gold prices will retrace lower to around $US2100/oz in the near-term as safe-haven demand eases.

US inflation data to be released on Tuesday will be key for the outlook on interest rates. “Our view that the FOMC will deliver 150 basis points of cuts by the end of this year suggests that US inflation will need to trend lower than expected in coming months,” he said.

“That should ultimately support gold prices through 2024 via a weaker US dollar. We think gold futures could finish the year at $US2200/oz to $US2300/oz” AFR electronic 2.28pm 12/03/24.

Have a very nice night

Kind regards
rcw1
 
Good morning
An article which appeared in AFR on 13/03/24, the last sentence perhaps says it all!!
Have a great week end.

Gold’s mystery rally baffles analysts​

Hopes of US rate cuts alone are unlikely to have driven the surge, say strategists. They also question central bank buying, Chinese households looking for havens, and war in Ukraine and the Middle East.

Harry Dempsey and Mary McDougall
Mar 13, 2024 – 3.50pm

The price of gold has surged 7 per cent in just over a week to hit record highs, leaving longtime market watchers struggling to explain what has been one of the yellow metal’s most curious rallies.

The sudden price move has lifted the haven asset above its previous peak reached in December to hit nearly $US2195 per troy ounce on Friday, according to LSEG data. Some commentators have attributed the move to growing expectations of US interest rate cuts, which would make the non-yielding asset relatively more attractive.
But several analysts say none of the factors that have driven gold’s bull run over the past 16 months are the likely catalyst for this recent rally. Those include record levels of central bank buying, Chinese households looking for havens for their money and the war in Ukraine and the Middle East.

“It has been the quietest, most confusing rally,” said Nicky Shiels, precious metals analyst at MKS PAMP, a Swiss gold refinery and trading house. “What took it from $US2000 [last month] to above $US2150 is the head-scratching part.”

The current rally kicked off when US manufacturing data at the beginning of the month showed a larger than expected contraction, strengthening investors’ conviction that the Federal Reserve could start to cut rates in June.
But the size of the moves in Treasury yields and the dollar did not appear to wholly justify the rally in gold, say analysts. The rate-sensitive two-year yield has fallen 0.12 percentage points since the start of March to 4.5 per cent, still much higher than January’s low of 4.12 per cent, while the greenback is still higher against a basket of six currencies than it was at the start of the year.
“Previously when we have had a rally of $US70 to $US80, it is usually accompanied by a new catalyst or risk event,” said Suki Cooper, analyst at Standard Chartered. “But this time there has been no significant shift in current events.”
Gold on Monday was trading at $2182 per troy ounce, after US jobs growth figures for December and January were downgraded sharply on Friday, adding further confidence to investors’ expectations of a rate cut in the first half of the year.
The nominal high has come despite outflows from gold-backed exchange-traded funds of 21 million ounces in the past year, according to Bloomberg. In contrast, bitcoin, which hit a fresh high above $US72,000 on Monday, has been boosted by billions of dollars pouring into ETFs since they launched in the US two months ago.

But Rhona O’Connell, analyst at commodities brokerage StoneX, said plenty of factors could justify a high gold price, such as China recently toughening its rhetoric on Taiwan, simmering banking tensions in the US and the elections coming in a number of countries this year. But she said none of those factors was behind last week’s move, and instead pointed to momentum traders – computer funds that latch on to rising prices – piling in after gold broke through a key price level. “There has been nothing specific or tangible we can point to apart from the done-to-death exercise of Fed watching,” O’Connell said.

‘Warning bells’​

The lack of immediately available data on flows in the market has led to suggestions that over-the-counter purchases by stealth buyers of gold, which are hard to trace, have dragged prices up.

Bernard Dahdah, senior commodities analyst at French bank Natixis, said the modest recent moves in the dollar and bond yields and continued outflows for ETFs had made it hard to pin gold’s rally on changing expectations of Fed rate cuts.

Neither could he attribute it to renewed demand from Chinese retail investors, because the premium for gold in China over London has narrowed, nor renewed central bank buying, as official institutions tend to buy slowly and want to go unnoticed.

“It’s the first time I’ve sat down discounting stuff rather than just saying what it is” that is moving the price, Dahdah said. “The ones who would be doing this would be a big hedge fund or asset manager” using derivatives.

In a sign of higher investor activity, the number of outstanding gold futures contracts on Comex has jumped 30 per cent since February 28, while net long positions rose about 64,000 to 208,000 contracts last Tuesday, according to Commodity Futures Trading Commission data.

“That rings warning bells for a substantial correction,” O’Connell said. “Once the momentum stops there will be profit-taking.”


Some believe the gold market’s rally is a symptom of investors running ahead of themselves on bets on rate cuts. “It’s not a foregone conclusion that the Fed is going to cut rates,” said Carsten Menke, head of next generation research at Julius Baer.

But not everyone believes gold prices are heading for a fall. Prices are still some way below the inflation-adjusted record of well above $US3000 per troy ounce hit in 1980 and some analysts say the current rally shows there is a firm floor under the price.

StanChart’s Cooper highlighted strong retail and central bank demand outside of the West, as well as the gold price’s jubilant reaction to marginal news supporting US rate cuts and its ability to hold up when data has pointed to rates staying higher for longer.

“There are too many unknown events that investors want to hedge for,” she said, citing elections, risks of conflict escalation or the return of a banking crisis. “It does look like we have new appetite in the gold market.”
 
Here's a bit of a strategy for Gold at present. Talks about support levels, but after reading my previous post I think a trajectory will be in order, I may be getting higher low on my MACD Divergence chart...Read and see what you think?

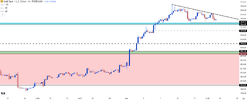
Given the blistering bullish breakout, there weren’t many pause points or support/resistance inflections along the way, and this could complicate support projection. As noted above, with the number of inflections seen at $2,075 and $2,082 over the past few years then, logically, that could be an area of interest.
But it’s so far away from current price that if we witness a near $100 breakdown in the spot price of gold, we’d have to ask if something else had shifted. But there was a quick swing around $2,130 and then the $2,100 level could be of use as a psychological level.
Perched atop current price is the descending triangle formation, accented by horizontal support bringing diminishing marginal impact to help produce lower-highs. This can keep the door open for a pullback and that’s something that could show ahead of the Fed next week.
But the bigger question to gold trajectory is the Fed, and I think that’ll remain a question until Wednesday afternoon when we get to see the updated projections in the SEP. If the Fed holds the line, expecting three rate cuts this year, we could see bullish motive soon return. But any moves towards ‘less dovish’ could push more motivation for the pullback.
And bigger picture, that $2,075-$2,082 area is a major point of contention. If we get that ‘less dovish’ outcome from the Fed, and the descending triangle has filled, that becomes a spot for possible reversals to play-in.

Spot Gold (XAU/USD) Four-Hour Price Chart
gold-four-hour-31524.pngChart prepared by James Stanley, Gold on Tradingview
 
Gold's Potential Upside in the Next Three Years

Jordan Roy-Byrne

I have focused on the coming secular shift in Gold and precious metals because it has massive implications over the coming years and into the 2030s.

However, I will discuss the cyclical potential of the current move in Gold today. With a strong close above $2100, Gold is in a new cyclical bull market.

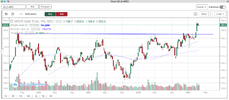
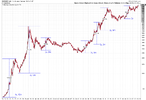
The chart below notes the historical cyclical bull moves in Gold.

Other than the first cyclical bull (which did not begin in earnest until late 1971) and the most recent, every cyclical bull lasted roughly three years, give or take a few months.

The cyclical bulls were far more powerful and volatile in the 1970s than in the 2000s.

Screenshot 2024-03-25 at 10.56.42 am.png

Gold’s breakout from a super bullish cup and handle pattern, which we have written about since 2021, triggers a measured upside target of $3000/oz.

In researching historical and similar breakouts, we found that the market at hand moved from its measured upside target to its logarithmic target in six to 12 months.

Gold's logarithmic target is around $4000/oz. That equates to a 117% cyclical bull market from the October 2023 low or 146% from the October 2022 low.

However, a breakout from a 13-year pattern around all-time highs will likely produce a more explosive move to the upside.

I do not expect the move to be as big as those in the 1970s (464% and 718%), but I do expect it to surpass the moves in the 2000s. A 200% gain from the 2022 low takes Gold to nearly $5000, while a 200% gain from the 2023 low takes Gold to $5500.

I am looking at the end of 2026 as a potential peak for the cyclical bull. That is four years from the 2022 low or three years from the 2023 low.

Gold fulfilling this potential requires a recession and downturn and strongly outperforming the conventional 60/40 portfolio. Gold has broken out against Bonds but has yet to against Stocks.

At present, Gold is only days past, potentially its most significant breakout in 50 years. Should the breakout hold, we should expect gold stocks, especially junior gold stocks, to dramatically outperform Gold over the next year or two.

To learn the stocks we own and intend to buy, with at least 5x upside potential in the new bull market, consider learning about our premium service.
 
Top