- Joined
- 19 October 2005
- Posts
- 4,684
- Reactions
- 6,956
PedanticI think that should read depleted rather than deleted.
Mick
PedanticI think that should read depleted rather than deleted.
Mick
yep sorry .. dodgy external keyboardI think that should read depleted rather than deleted.
Mick
No, not pedantic, merely correct.Pedantic

No one knows what the market will do until it shows us, we all look for clues then wait to see what happens, eventually we learn which clues work better than others. A most important element is 'keeping an open mind' and you have that, so we will both gain a bit of extra knowledge from seeing what happens with gold.I',m trying to practice what I preach. And feel if it doesn't go south this week there will be further sideways action with a further push north. Who the bloody hell knows. Its a tosser, US economics are strong, but are those resources holding up, there end of Gold equity.
A bit sus I don't think I've got a clue?
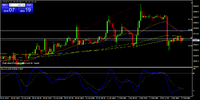
Triangular behaviour continues
Quite an interesting reaction I would say, more triangular behaviour up here just below the resistance zone
Confluence of supply and demand makes consolidations like triangles, everybody is agreeing on the price, for now.
View attachment 170439
Good morning @InsvestoBoy
Most interesting stuff indeed.
If rcw1 could be so bold as to inquire with you on this further please.
What would the triangles signify if they were to be the other way around, the second triangle formation lower than the first triangle within a similar timeframe that has already existed?
Pardon rcw1 ignorance.
Kind regards
rcw1
nice, thanks for that @InsvestoBoy, rcw1 gets it. Much appreciated bloke.Consolidations generally occur when existing participants on both sides of the order book can have their supply and demand requirements met at and around the current price.
The size of the consolidation can vary from very tight (per above screenshots) to very wide (but still technically be a consolidation), generally speaking the tighter it is the shorter it will be. Wide consolidations can last a long time, weeks, months or years.
In liquid markets, if the consolidation is very tight and lasts for a long time, you are probably looking at a currency peg.
The consolidation will resolve when either new participants with different S/D requirements have business to conduct in the market or the S/D requirements of the existing participants changes.
It's just a record or story of what happened, whoever was in the market during the first triangle to buy was met with enough supply to keep them happy, at which point either the supply at that price was withdrawn or the amount of supply was no longer adequate for the level of demand, the price rose a bit seeking new supply then new supply was introduced or existing demand was met by the existing supply at that new level.
If the picture was as you describe, the story would simply be reversed, supply was matched with demand during the first triangle, at which point either new supply came on at that price or demand at that price withdrew, down to a new nearby point at which a new equilibrium was reached.
On the 1st Feb, I had a guess that the area that became the top of the current triangle would be where the demand that was driving price up would meet some existing supply, simply because that was where supply had most recently overwhelmed demand previously (ignoring the 5% range from 4th Dec because - as I wrote at the time - I believed that to just be noise from low liquidity Monday trading).
The thing is, you never know when new participants with different S/D requirements will enter the market, or when the S/D requirements of existing participants will adjust, so technicals are only ever certain to be a story of the past, only sometimes but not necessarily a story of the future. Tomorrow someone could invent a way to synthesise gold at a cost of $100/oz, or Goldfinger could make all the gold reserves radioactive. You don't know and the chart will never be able to tell you.
Oh bugger, another set of half conversations.Good morning @InsvestoBoy
Most interesting stuff indeed.
If rcw1 could be so bold as to inquire with you on this further please.
What would the triangles signify if they were to be the other way around, the second triangle formation lower than the first triangle within a similar timeframe that has already existed?
Pardon rcw1 ignorance.
Kind regards
rcw1
Oh bugger, another set of half conversations.
It seems I have been blocked by Investoboy.
Hard to participate when you only get half the discussion.
Mick
I had a more proactive approach,#MeToo not sure why. Maybe I moderated some trash he spat out.
I was just thinking about Gold and I’ll use one of @Sean K ’s charts to illustrate my thinking.
View attachment 169459
A burst up to $USD3000 is on the cards as a medium to high possibility given the long length Gold has stayed at about $USD2000.
A fall to $USD1800 is possible but unlikely. A fall to $USD1600 is unlikely and highly improbable. I would be very interested at both those levels should they ever be seen again.
gg

Hello and welcome to Aussie Stock Forums!
To gain full access you must register. Registration is free and takes only a few seconds to complete.
Already a member? Log in here.