Australian (ASX) Stock Market Forum

Gold Price - Where is it heading?

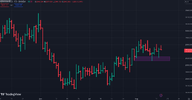
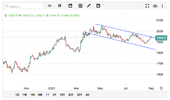
On a very short term market structure basis, I feel that 2912-2925 is critical support, inability to hold that zone in context of the medium term pattern of the last 6 months, is negative.

On the plus side, move above the current intraday high could cause a bit of a short squeeze as stops get run.

1692170733095.png
 
I generally feel uncomfortable when gold makes an outsized up move during Asian trading sessions, usually London is happy to reverse it.
 
A combination of $AUD weakness and the Fed and local employment figures contributing to Gold in $AUD heading for $3000 again.

Holders holding. New buyers getting off the sidelines due to delicious fear in XAO.

pmgold.png

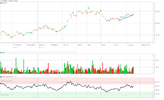
Note RSI divergence.

gg
 
On the plus side, move above the current intraday high could cause a bit of a short squeeze as stops get run.

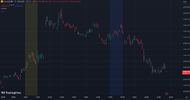
I think the squeeze is pretty much done here and real demand will have to take over to drive the price any higher.

Todays close is an important one as it will set the closing price for August, if the price can stay above $3000 it would be the first monthly bar above $3000 that didn't show any supply.

1693435394454.png
 
I think the squeeze is pretty much done here and real demand will have to take over to drive the price any higher.

Todays close is an important one as it will set the closing price for August, if the price can stay above $3000 it would be the first monthly bar above $3000 that didn't show any supply.

View attachment 161666
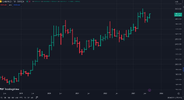
Lovely trending chart :) have in mind my AUD gold price target of $3,600 (based on longer term monthly bull cycle price chart).
 
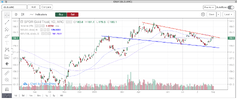
Interesting juncture. I've been buying stuff at the bottom of these channels.

Could obviously break downward at some point and I'll be much poorer.

View attachment 161992View attachment 161993
if gold goes down massively, one of two things have happened, somebody ( like JP Morgan )has shorted gold heavily or there is a major liquidity event ( like the GFC ) squeezing the over-leveraged
 
or the Landlubbers have fallen out of love with their Pet Rocks and Turned to the safety of the more useful Commodities
but unlikely given the bulk of the same value of copper , coal oil or even uranium

nice if you don't have to store them at home , but also prime candidates for confiscation during an emergency such as a war
 
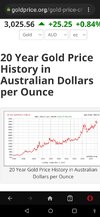
AUD Gold price reached an intra-day high of $3,055! earlier today.. talk about a bullish looking chart as looks amazing!

View attachment 162058
Thanks @Telamelo ,

I can only see the $USD getting stronger versus our little Real. Onwards and upwards Gold Bar, priced in the universal currency will be the consequence for $AUD Gold. Your chart shows the value of buying both on pullbacks and on breaching new highs. There is enough profit there for long, medium and short term traders and investors.

It may be time to take granny to the dentist and put her back on bread and milk.

gg
 

Russia driving the multi-trillion gold runaway train​


now when there was an announcement of a 'gold-backed ' BRICS currency , i was half expecting that BRICS members to agree to settle their ( inter-member) trade balances in gold bullion since all the current BRICS members respect gold ( and silver )
 

Time to Back the Truck Up​

By Jeff Clark, editor, Market Minute

We are approaching a “back the truck up” opportunity to buy into the gold sector.

These chances only come along once or twice each year.

Traders who are ready for them stand to make huge gains.

We got two such opportunities in 2021. We had one chance last year.

And, we’re about to get our first “back up the truck” moment for gold stocks in 2023 when the Bullish Percent Index for the Gold Sector (BPGDM) generates a buy signal.

The BPGDM measures the percentage of gold stocks that are trading in a bullish technical formation.

It’s a gauge of overbought and oversold conditions. Since it’s measured as a percentage, a bullish percent index can only reach as high as 100% or fall as low as zero.

Typically, a sector is extremely overbought when its bullish percent index rallies above 80. It’s extremely oversold when it drops below 30. Trading signals are generated when the index reaches extreme levels and then reverses.

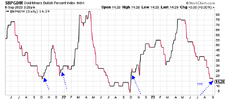
Take a look at this two-year chart of BPGDM…
20230912-JMU-01_irw141.png

The first three blue arrows point to the BPGDM buy signals over the past two years.

The gold sector rallied about 20% in six weeks following the first buy signal in 2021. It gained 30% in three months after the second buy signal.

And, following the BPGDM buy signal last October, the gold sector again gained 30% in about three months (we had a couple of false buy signals in July and September before we got one that stuck in October).

Currently, the BPGDM is in extremely oversold territory. It will generate a buy signal when it turns higher from this condition.

Of course, we don’t need a BPGDM buy signal in order to profit in the gold sector.

Traders could have made several profitable trades in gold stocks this year without the benefit of a buy signal. But, adding exposure to the gold sector when BPGDM says to buy is like running with the wind at your back.

We don’t have that buy signal yet. But, the chart is setting up for it.

And, when it happens, gold stocks should perform quite well for several weeks.

Best regards and good trading,
Jeff Clark
 
Top