Australian (ASX) Stock Market Forum

Gold Price - Where is it heading?

Years ago, forget how many, the CCP very strangely began encouraging its citizenry to save in gold and silver.
It's dollars to donuts imo that the boundlessly evil CCP will force private gold holders to exchange their metal for paper some day and that was their stinking plan all along.
 
Years ago, forget how many, the CCP very strangely began encouraging its citizenry to save in gold and silver.
It's dollars to donuts imo that the boundlessly evil CCP will force private gold holders to exchange their metal for paper some day and that was their stinking plan all along.

Interesting thought. But maybe they'll slip a gold or silver strip in their notes to make them backed by something tangible instead of a promise? Hmm, unlikely.

(if you need some hints on how to survive in the wild I'm a qualified Army survival instructor)
 
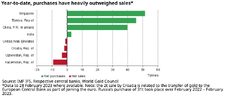
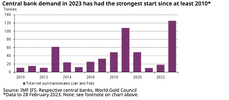
Decided to have a look at which countries have been buying gold, either through their citizens or via the CB's.
Among the buyers, the People’s Bank of China was the largest. It added 21t to its gold reserves during June, the eighth consecutive month of purchases. Since it began reporting increases in November 2022, gold reserves have grown by 165t (+8%), of which 103t has been bought in 2023, making it the largest buyer y-t-d.
1694592012105.png
Apart from China, the big buyers are seen below
1694592152425.png


Given that the BRICS countries have bought so much gold, would the non BRICS (e.g. USA, UK, EU, Canada OZ etc) then decie to keep downward pressure on gold to keep the BRICS in check?
Nominally, the USA is the biggest holder of Gold, but as iuts never been audited, one never really knows.
You never know really what the international skullduggery with gold might become.
Mick
 

Attachments

  • 1694592077781.png
    1694592077781.png
    63.1 KB · Views: 2
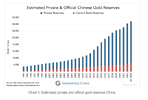
My notion came from the chart that ducati posted on the previous page. Check how much gold is held privately (blue) compared to Central Bank (red). The tonnage in blue is the CCP's shadow CB gold hoard imo. It can be exchanged for 'gold backed' digital/paper currency one day, i.e confiscated. The private citizen has no say.

Screen Shot 2023-09-07 at 9.06.06 AM.png
 
Years ago, forget how many, the CCP very strangely began encouraging its citizenry to save in gold and silver.
It's dollars to donuts imo that the boundlessly evil CCP will force private gold holders to exchange their metal for paper some day and that was their stinking plan all along.
My notion came from the chart that ducati posted on the previous page. Check how much gold is held privately (blue) compared to Central Bank (red). The tonnage in blue is the CCP's shadow CB gold hoard imo. It can be exchanged for 'gold backed' digital/paper currency one day, i.e confiscated. The private citizen has no say.

View attachment 162408

I suppose confiscation could happen, however practically it may be difficult.

How much private Gold is traceable and sticky and also how much is easily convertible to cash would ne interesting to know. I doubt if any charts will show this. My impression is that the average Chinese person loves their Gold and won't let the CCP or anyone else "take a grab" of it.

gg
 
So this article: https://goldseek.com/article/west-losing-control-over-gold-price

Then add in these 2

Screen Shot 2023-09-17 at 3.04.48 AM.pngScreen Shot 2023-09-17 at 3.05.17 AM.png

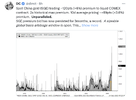
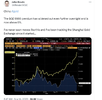
Factor in the news from the BRICs summit that Russia will sell gas and oil to China at a 50% discount to the West and you have an arbitrage opportunity. As an (true) arbitrage = 100% profit, this will be done by every hedge fund : short 30 barrels of oil in London, buy 1 oz. of gold with the proceeds, take the gold from London to Shanghai or Hong Kong, receive 60 barrels of oil, sell 30 of those barrels of oil to cover their oil short in London, and then sell the other 30 barrels of “free” oil for a risk-free profit… wash/rinse/repeat...which will force LBMA to promptly declare force majeure or put capital controls on gold movements to China and Russia.

Which is essentially Russia weaponising oil against the West.

jog on
duc
 
So this article: https://goldseek.com/article/west-losing-control-over-gold-price

Then add in these 2

View attachment 162523View attachment 162522

Factor in the news from the BRICs summit that Russia will sell gas and oil to China at a 50% discount to the West and you have an arbitrage opportunity. As an (true) arbitrage = 100% profit, this will be done by every hedge fund : short 30 barrels of oil in London, buy 1 oz. of gold with the proceeds, take the gold from London to Shanghai or Hong Kong, receive 60 barrels of oil, sell 30 of those barrels of oil to cover their oil short in London, and then sell the other 30 barrels of “free” oil for a risk-free profit… wash/rinse/repeat...which will force LBMA to promptly declare force majeure or put capital controls on gold movements to China and Russia.

Which is essentially Russia weaponising oil against the West.

jog on
duc
So clearly described👍 thanks Mr @ducati916
 
Wait or Make a Move? The Fed and Gold Prices
By Jeff Clark, editor, Market Minute


The FOMC announcement tomorrow afternoon could send gold to new highs.

Of course, this shouldn’t come as a surprise. The price of gold is often volatile around Fed days.

For example, gold spiked $60/oz. right after the FOMC meeting in July. After the June meeting, it dropped $48 in two days. And after rallying $50/oz. In the days prior to the meeting in May, gold spent the next two weeks losing more than $100/oz.

But here’s why this week’s meeting could trigger a larger-than-average move…

First, take a look at this chart…
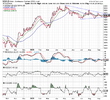
20230919-JMU-01_iuw141.png
Similar to the chart of the S&P 500 we looked at last Thursday, gold is forming a “consolidating triangle” pattern. This happens as the price makes a series of lower highs and higher lows.

All the moving averages have coiled together. And all the momentum indicators at the bottom of the chart are in neutral territory.

Energy is building for gold to make a big move.

How big?

Based on the height of the triangle pattern, gold could move as much as $150/oz. higher or lower.

In the days ahead, gold could be trading at new highs near $2,100/oz., or it could tumble back down towards the March low near $1,800.

Just like the S&P 500 chart, though, there is no edge to either side at the moment. Betting on the direction at this point is like betting on a coin flip.

Most traders are probably better off waiting for gold to break out of its consolidating triangle – making either a move above $1,975 or below $1,925.

One way or another, though, the FOMC announcement on Wednesday is shaping up to be a pivotal event for both the broad stock market and for gold.

Best regards and good trading,
jeff-clark-signature.png
Jeff Clark
 
Interesting stuff. Are you a subscriber, Dave?
@Sean K , no I'm not a subscriber, every now and then they send me the videos and I like to know about the big cycles just like I like to know about the big fundamental picture. My trading though is based on reading what a market is doing and timing my entry and exit. I value the context that the big picture provides.
 
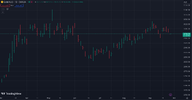
I think the squeeze is pretty much done here and real demand will have to take over to drive the price any higher.

Todays close is an important one as it will set the closing price for August, if the price can stay above $3000 it would be the first monthly bar above $3000 that didn't show any supply.

View attachment 161666

So far no appearance of real demand in the price action but rather all the hallmarks of >3000 remaining well supplied

1695770897550.png
 
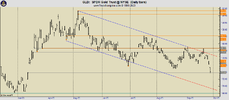
US Gold (GLD) is going down but the question is how far down. I'm going to put up some charts to show what is happening. A couple of parallel lines on the daily chart mostly contains the price action in a channel heading down.
1695865251146.png

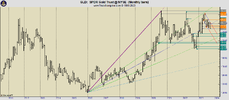
This daily chart is looking at the market at ground level but I want to fly up and have a birds eye look at the big picture to see if we still see a down trend when looking at the overall market. To do this I'll put up a monthly chart with time and price Fib lines on it. This clearly shows that on the monthly time frame the GLD market is still in an uptrend. The price action from the Nov22 low shows that the weekly time frame is also in an uptrend so I'll put up a weekly chart next looking for a possible price level for price action to reverse thereby maintaining the uptrend.
1695866068612.png

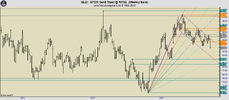
Looking at the weekly chart below, price will need to reverse at or above the 168 level in the next three weeks in order to maintain the uptrend of the market. We can only wait and see.
1695866710061.png
 
Top