Sean K
Moderator
- Joined
- 21 April 2006
- Posts
- 22,379
- Reactions
- 11,748
I think I know what you meanThere was a fight between bulls and bears between 9 and 11 last night's morning. Result, draw. No follow through...
Even as the commercials fiddle with their paper derivitives, CB's are quietly hoarding physical.There’s no sign of a slowdown in central bank gold buying.
In February, central bank gold reserves rose by another 52 tons, according to the latest data compiled by the World Gold Council.
It was the 11th straight month of central bank net gold purchases.
Through the first two months of 2023, net central bank gold purchases came in at 125 tons. This is the strongest start to a year since 2010.
China was the biggest buyer in February. The Peoples Bank of China increased gold holdings by a reported 24.9 tons. It was the fourth consecutive month of reported Chinese gold purchases. In that time, China’s official gold reserves have grown by 102 tons.
The Chinese central bank accumulated 1,448 tons of gold between 2002 and 2019, and then suddenly went silent until it resumed reporting in November 2022. Many speculate that the Chinese continued to add gold to its holdings off the books during those silent years.
There has always been speculation that China holds far more gold than it officially reveals. As Jim Rickards pointed out on Mises Daily back in 2015, many people speculate that China keeps several thousand tons of gold “off the books” in a separate entity called the State Administration for Foreign Exchange (SAFE).
Last year, there were large unreported increases in central bank gold holdings. Central banks that often fail to report purchases include China and Russia. Many analysts believe China is the mystery buyer stockpiling gold to minimize exposure to the dollar.
Turkey continued to pile up gold, adding another 22.5 tons of gold to its hoard in February. The Central Bank of Türkiye was the biggest gold buyer in 2022 and has increased its gold holding for 15 straight months.
Turkey has been battling rampant inflation. Price inflation accelerated to as high as 85% last year and was at 64% in December. The Turkish lira depreciated by almost 30% last year. Meanwhile, the price of gold in lira terms increased by 40% on an annual basis, according to Bloomberg.
After a pause in January, India went back to buying gold in February, adding 2.8 tons to its reserves. India ranks as the ninth largest gold-holding country in the world. Since resuming buying in late 2017, the Reserve Bank of India has purchased over 200 tons of gold. In August 2020, there were reports that the RBI was considering significantly raising its gold reserves. India now holds 790 tons of gold.
After a massive 44.6-ton increase in its gold reserves in January, Singapore continued its buying spree in February with another 6.8-ton purchase.
The Central Bank of Uzbekistan added 8 tons of gold to its reserves, following three consecutive months of sales.
Mexico bought 0.3 tons of gold in February.
The National Bank of Kazakhstan was the only notable seller in February, decreasing its reserves by 13.1 tons. It is not uncommon for banks that buy from domestic production – such as Uzbekistan and Kazakhstan – to switch between buying and selling.
The Central Bank of Russia disclosed its gold reserves for the first time in over a year, reporting gold holdings of 2,330 tons at the end of February 2023. That was a 31-ton increase since its last report. The timing of the gold purchases remains unclear.
The World Gold Council said it expects net central bank gold buying to continue through 2023. According to the WGC, emerging market banks remain relatively under-allocated to gold.
Overall, we expect further buying, with EM banks at the forefront of this trend as they continue to redress the imbalance in gold allocations with their developed market peers.”
Total central bank gold buying in 2022 came in at 1,136 tons. It was the highest level of net purchases on record dating back to 1950, including since the suspension of dollar convertibility into gold in 1971. It was the 13th straight year of net central bank gold purchases.
According to the World Gold Council, there are two main drivers behind central bank gold buying — its performance during times of crisis and its role as a long-term store of value.
It’s hardly surprising then that in a year scarred by geopolitical uncertainty and rampant inflation, central banks opted to continue adding gold to their coffers and at an accelerated pace.”
World Gold Council global head of research Juan Carlos Artigas recently told Kitco News that the big purchases underscore the fact that gold remains an important asset in the global monetary system.
Even though gold is not backing currencies anymore, it is still being utilized. Why? Because it is a real asset.
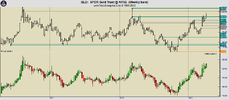
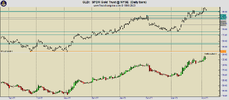
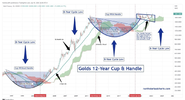
There are too many cases of people just making a chart fit into some pattern after the fact. I like to read what the market is doing and if this looks like it is making a pattern then that may give you some levels watch out for.A couple more TAs ramping the big arse C&H that's been pointed out for too long. Will it or won't it?...
View attachment 155604
"Technical analysis is key to understanding what's going on with gold" - Northstar and Badcharts | Kitco News
(Kitco News) - We’re on the verge of massive moves for precious metals, bonds and the stock market, but investors who wait for the economic fundamentals to catch up to price action will miss out, according to technical analysts Patrick Karim and Kevin Wadsworth of NorthstarBadCharts.com.www.kitco.com
There are too many cases of people just making a chart fit into some pattern after the fact. I like to read what the market is doing and if this looks like it is making a pattern then that may give you some levels watch out for.
Yeah I think that I posted one at one point as well but I remember that the handle that I had drawn didn't work out. The thing that I don't like is when people keep redrawing to fit in with the new price action. I think that patterns are more useful when they have more defined rules.Yeah, but this long term C&H has been noted by lots of players over the past couple of years. It's definitely there.
You need to get a life. Try watching T.V like me. Not all at once, start with half hour programmes and build up.I'm on the edge of my seat watching gold trying once again for ATHs. ?
With great respect I believe the cup and handle to be a load of old crock.Yeah I think that I posted one at one point as well but I remember that the handle that I had drawn didn't work out. The thing that I don't like is when people keep redrawing to fit in with the new price action. I think that patterns are more useful when they have more defined rules.
With great respect I believe the cup and handle to be a load of old crock.
gg
Hello and welcome to Aussie Stock Forums!
To gain full access you must register. Registration is free and takes only a few seconds to complete.
Already a member? Log in here.