Australian (ASX) Stock Market Forum

Gold Price - Where is it heading?

got those NST ( 5 cents cheaper than planned , to boot ) , now the extra EVN look possible too , in the near future

just have to resist 'backing up the truck 'when buying
 
All the stock charts show it's been a brutal year for the goldies. How have you survived after being crushed into smaller pieces, sieved and washed away with the waste?

TIE and RED look to be the only charts with some promise. May I suggest something for you're depression, lithium?
 
got those NST ( 5 cents cheaper than planned , to boot ) , now the extra EVN look possible too , in the near future

just have to resist 'backing up the truck 'when buying
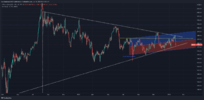
I've bought both NST and EVN over the past few months, but there's no backing up the truck. I've been waiting for a positive breakout on gold to deploy $$, which should occur at some stage, but timing is the problem, unless you are 100% invested in the gold thesis. I think a few of us saw a bottom in late Sept last year, but the price has failed at key resistance levels repeatedly since. So, until the upper levels are breached properly, the gold bull hypothesis is just an hypothesis.
 
All the stock charts show it's been a brutal year for the goldies. How have you survived after being crushed into smaller pieces, sieved and washed away with the waste?

TIE and RED look to be the only charts with some promise. May I suggest something for you're depression, lithium?
Has been hurtful indeed
 
All the stock charts show it's been a brutal year for the goldies. How have you survived after being crushed into smaller pieces, sieved and washed away with the waste?

TIE and RED look to be the only charts with some promise. May I suggest something for you're depression, lithium?
Isn't the saying that "timing is everything?"
Lithium has already had a decent run so how much more is ahead?
Timing POG has always been fraught as it's demand is principally speculative.
Last week we went from an upside breakout likely to a case where downside was more likely:
1643498326165.png

The 6-month trend is up, but if you add more or fewer months to the regression then that trend moves all over the place, so it's effectively meaningless.
Nevertheless, the chart pattern must break one way and the only issue will be if it becomes an outlier rather than the longer trend.
 
Gold is bearish atm.

Just accept it and go with it is my advice.

Whether to accumulate and wait depends on your risk tolerance and size of pot.

Whether to sell and invest elsewhere depends on finding a better elsewhere.

200.gif

gg
 
Gold’s attempted rebound from last week’s sell-off is already struggling as it’s seemingly being fuelled by a decline in the US Dollar rather than strong demand for the precious metal.

In fact, when compared to other FX majors in an equally weighted basket, it is quite apparent that gold is becoming weaker and is actually at risk of further downside if. In order for gold to form a sustained leg higher, it will likely need to be supported from a decline in real yields and continued weakness for the USD, pushing investors back into the market.

All trading carries risk, and with so many important determinants, the situation needs to be closely monitored before making any decisions.
 
Breakdown of USD is the main reason to hold gold atm imo.
Gold could be supported further by as the USD continues to fall after last night’s ADP data, which will likely add to expectations of a weak NFP report tomorrow. This would go against the Fed’s hawkish stance, potentially sending real yields lower, allowing gold to rally.

However, if the ECB remains dovish today despite the hot EU inflation print, we might see some USD bulls step back into the market.

All trading carries risk, but it will be interesting to watch how the situation unfolds over the rest of the week.
 
@Sean K

Quite the opposite and this is my reason.

That upper trend line is not valid for chart purists.

It should start from the higher high a month prior and I have enclosed a PMGOLD chart which shows that in $AUD. Unfortunately I don't have access to drawing on charting of gold in $USD. They are very similar though and the triangle is now complete.

PMGOLD is consolidating and the RSI is rising.

So the crossover has occurred and I am again bullish on gold.

It just takes that darn crypto to get out of the way which will happen as the Mutual Funds crash taking crypto with them and everyone returns to cash/proper value stocks/gold and "normal" and packs the cocaine away in Silicon Valley and Cryptoland for the next Tulip.


gold.png

gg
 
@Sean K

Quite the opposite and this is my reason.

That upper trend line is not valid for chart purists.

I may agree, but I discounted the top in Aug 20 as it looks like a blow off top type of thing that was part of an irrational overshoot.

I prefer your chart. :)

And, I'm hoping @qldfrog is correct. I'm banking on it. But, I'm prepared for the worse.

Shouldn't you be down on Palmer St somewhere?
 
POG 4-hourly chart below shows a $40 increase over the past week, with pennant formation yet to break either way:
1644280315711.png
It's fair to say we have been in a wishy washy sideways trend for the past year, with nothing suggesting POG is either weak or strong.
The trend regression since last December is, nevertheless, nicely positive, so another $25 upside would provide further impetus for POG to resume its longer term bull run.
 
I now watch carefully the BTC GOLD chart, as this will be a marker for a significant move up or down in gold, more likely the former.

The USD chart is meaningless to me, the AUD less so.

BTC has had one of it's bigger up weeks recently and it now costs 24oz gold to buy 1 bitcoin.

Say 25oz for argument sake.

Would you swap 5 X 5oz Gold Bars of Gold for 1 Bitcoin?

That is the question.

Screen Shot 2022-02-08 at 11.48.01 am.png


gg
 
Top