Australian (ASX) Stock Market Forum

Futures trading journal - GB

That's enough. 60 tickeroos. Looking very weak tonight.

Will pick up tomorrow with the retail sales figs. Got the day wrong.
 
You're sure there isn't a bogeyman hiding behind the screen? Time for a rest?
 
You're sure there isn't a bogeyman hiding behind the screen? Time for a rest?
Oh there's definitely a bogeyman! All traders must face him and get to know him intimately....even love him! The trading bogeyman appears at first as an ugly annoyance, a hindrance, a weasel, something to be rid of. But he is truly our greatest ally. He shows us exactly what is required in order to win.

It is the voice that says "Wait... are you sure? What if it moves against you? Stop/go...no!!". Feel that voice, see it, know it, work with it, circumscribe it, study it. All profits come by the study of that little voice. If we deny the voice or try to avoid it, it grows. We have to welcome it, be gentle with it, recognize it is part of the game, showing us how to win. It may appear otherwise, but the bogeyman wants us to win.

Are you ready for some deep philosophy?

The bogeyman is me - and I am it. We are one and the same, choosing to wear different disguises for the purposes of playing the game of life.


ES - waiting for 4133.5.
 
The bogeyman is hiding behind my screen.......he says I can win, but I say 'not now, I'm gonna feed the fish, cya tomorrow''
 
The bogeyman is hiding behind my screen.......he says I can win, but I say 'not now, I'm gonna feed the fish, cya tomorrow''
Ah yes, the "not now, not yet" bogeyman. I have him sitting here on my shoulder, whispering into my ear. In fact he's been there since starting this thread. I'm getting to know him quite well. An ugly critter if I've ever seen one, but I do my best not to judge. That's the key, I think. I have to find it within me to see the good in my little ally. But wait..... exactly whom is he trying to protect - me or himself?

When I asked that question, he hid momentarily. Could be a clue in that.
 
You can beat your bogeyman, GB. It's all about mindset. My mind has shifted......

At the moment, my bogeyman has the upper hand....I'm not in the right frame of mind to trade. So, put some into cap notes that I sold few months ago (now cheaper) They will pay distributions in June. Bought some bank shares got their divs but going nowhere now, so I'm about even. The new note, AN3PK went for a dive today (distribution next month) Bought some of that. Other than that, I don't know what to do other than try to pick the bottom of some good stocks.....you care to share yours?
 
Largest wind up I've seen without a breakout resolution. Indicates the breakout will be a long, sustained move. Probably upwards.
 
L 4133.5
T 4151.75
trade was stopped

What I'm seeing is a huge accumulation - or perhaps distribution - phase continuing (8 May to now). Since the 3-touch trednline is overhead, I suspect it's accumulation, and when it breaks there will be a large and sustained upwards move. There's no news for a long time yet (Fed on May 25), but at some point the banks will find it difficult to extract much more liquidity from these levels and it will necessitate the move up to 4244.75. 4244.75 is the weekly imbalance level.
 
Last edited:
The big trendline has been broken. It won't be a straight line up, but I'm expecting a large and sustained move now.

If there's strong buying I will move my target higher, perhaps up to the weekly imb at 4244.

edit: yep, pulling my sell order.
 
Holding.

If there's a retrace (unlikely), it will be to 4155 or 4160.

There's two levels where I expect profit taking - 4180.75, 4188.5. But there's enough build up to this move that it should go further. Above that there's buyside liquidity at 4206 which should cause a major pause, if not reversal. That will be a difficult decision - whether to hold there or sell. At the moment I think 4229 is a more likely place to sell than 4244. [Also, all of this could be wrong]

Those who know how to read point & figure would be able to say how far it wil go. I've never been able to make sense of it.
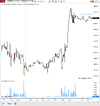

First hurdle will be 173, might be tested soon.

Closing below there could have been a clue that there is still some caution out there

1684383781304.png
 
look left a few days
Right - the daily imbalance level (pivot point). I discounted that because it pushed a long way through it last night (20 ticks - what I consider a long way).

I do the same with trend line targets. If it gets to the target and can close even a single 1 min bar 5 ticks above it without hesitation, to me that means it will not only revisit it, but break through it next time and continue up.

Maybe you're right - it did have a lot of volume in it compared to other pivot levels, but there's been a lot of buying so far today.

x.png
 
Right - the daily imbalance level (pivot point). I discounted that because it pushed a long way through it last night (20 ticks - what I consider a long way).

I do the same with trend line targets. If it gets to the target and can close even a single 1 min bar 5 ticks above it without hesitation, to me that means it will not only revisit it, but break through it next time and continue up.

Maybe you're right - it did have a lot of volume in it compared to other pivot levels, but there's been a lot of buying so far today.

View attachment 157080

I wasn't referring to that, it is just a level that was rejected at the close last night. A previous High
 
Top