Australian (ASX) Stock Market Forum

Futures trading journal - GB

Bear phase finished!
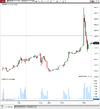
How was that little pump a few mins before the news release?
:laugh:

If we're back in a bull market, they may use FOMC tomorrow to grab some more liquidity. If they don't, it may be difficult to get a position.
 
Last edited:
So, it wasn't just me who missed that information. I only found out after market closed yesterday. Didn't look at the graph in detail but had a feeling things were going a bit off colour after lunch.
 
So, it wasn't just me who missed that information. I only found out after market closed yesterday. Didn't look at the graph in detail but had a feeling things were going a bit off colour after lunch.
Your subconscious can pick up tons of information in a split second. That's where the feeling comes from (and why trading psychology is so important, IMO).

There was the typical directionless but 'tight' price action.
Several areas of high consecutive red bar count.
Several areas of high volume in downswings without recovery.

Aside from the red bar count, the other two I haven't been able to code. But I can see them.
 
Trading psychology is an interesting topic. But in the end it comes down to edge, you can have the best psychology in the world but you can't make a losing strategy a winner. You could have a strategy with massive edge but executed with terrible psychology and still have a winning formula

But then the next step gets messy. How can you accurately test a discretionary trading strategy to know that it has positive edge if you have bad psychology? With a systematic strategy it is relatively straightforward, do the testing accurately and without bias and then apply it as it should be. Not that that is easy but you should have the edge part figured out.
But with a discretionary strategy, you have to test your theory accurately to know if it has edge. But to do this you have to have good discipline and psychology.
 
Your subconscious can pick up tons of information in a split second. That's where the feeling comes from (and why trading psychology is so important, IMO).

There was the typical directionless but 'tight' price action.
Several areas of high consecutive red bar count.
Several areas of high volume in downswings without recovery.

Aside from the red bar count, the other two I haven't been able to code. But I can see them.
If we follow the market closely, we feel the under currents.

By the way, I found out this morning that the dip yesterday was because of China's economic data. Was on Commsec's closing report yesterday by Steven Daglain..........Commsec has pre market and closing report each day. Find it informative and certainly helpful. News also on investing.com
 
Trading psychology is an interesting topic. But in the end it comes down to edge, you can have the best psychology in the world but you can't make a losing strategy a winner. You could have a strategy with massive edge but executed with terrible psychology and still have a winning formula

But then the next step gets messy. How can you accurately test a discretionary trading strategy to know that it has positive edge if you have bad psychology? With a systematic strategy it is relatively straightforward, do the testing accurately and without bias and then apply it as it should be. Not that that is easy but you should have the edge part figured out.
But with a discretionary strategy, you have to test your theory accurately to know if it has edge. But to do this you have to have good discipline and psychology.
I think our subconscious beliefs will determine the outcome no matter what approach we use, even if it's 100% systematic.

Trading with 100% discretion is just about feeling out the market and responding. Your edge is your ability to be in tune with what you feel.
 
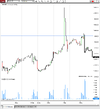
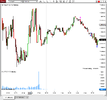
ES. 8:01am our time, big volume swing once again. 100x usual. Was it bid or ask? Without being able to see inside the 1 min bars, I have no idea. This is the big advantage of platforms like SierraChart. Their tick volume studies are the best in the business.

x.png
 
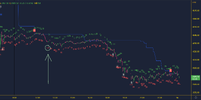
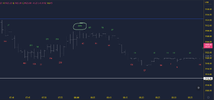
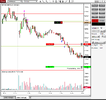
I have never traded ES during its regular market hours but the speed at which moves and the amount of points it covers even during our afternoon/evening is so much more than the Nikkei. There is a lot lot of money to be both made and lost in a short amount of time. I was hoping it was going to push up to that level identified a couple of days ago during our afternoon so I could get a position on in my live account, get the stop to break even and just let it go. Unfortunately it did it overnight our time… oh well

I've been sitting in a short on the Nikkei all day but I made more money on the ES in a couple of hours. Obviously it is pretty volatile at the moment but with a similar amount of risk you can get a lot more bang for your buck.

1671169334181.png

1671169393136.png
 
ES. 8:01am our time, big volume swing once again. 100x usual. Was it bid or ask? Without being able to see inside the 1 min bars, I have no idea. This is the big advantage of platforms like SierraChart. Their tick volume studies are the best in the business.

View attachment 150551
I thought this had something to do with the option expiry date, GB. Could be wrong there.
 
TV would be a great platform if it stored historical tick, bid-ask data. As it is, you have to use clunky workarounds. Very difficult to see whether the instos are buying or selling.

Aside from SierraChart, are there any decent platforms which cater to order flow analysis?
 
Top