Australian (ASX) Stock Market Forum

Dump it Here

Mark Minervini
Million Dollar quote of the day.

View attachment 149097

Skate.
I can understand how to Control Risk
But
How do we control Potential Reward?

He must be Joking!

Does he think this is like "Horse racing?"

It is only a Loss if you haven't learnt anything this week
Lessons are so very expensive in "This Greatest Sport of Them All"


Attachments

  • BB.gif
    BB.gif
    3.4 KB · Views: 3
Last edited:
"It is not about adding on, but taking away. The less technique, the better you are." - Bruce Lee

@rcw1 is quoting "Bruce Lee"
There is something that can be gleaned from the remark as it can be applied to system trading. As coders, we all tend to bloat the idea of what makes a great buy condition. The one-liner is all about not adding but taking away, basically keeping the strategy simple. This has me thinking, can a strategy be coded using one indicator as a buy condition?

Well I think I've found one in my toolbox
The Volume-Weighted Moving Average (VWMA) is the indicator of choice, it's powerful yet simple. The Volume-Weighted Moving Average (VWMA) is very similar to a standard Moving Average but it includes volume. The neat thing about this indicator is that each price is weighted with its volume. Another thing, this indicator can be applied to any timeframe. I'll make a series of posts on the benefits of the (VWMA) indicator & highlight some disadvantages so it's balanced. In conclusion, I'll backtest the strategy to evaluate its effectiveness.

Skate.
 
The volume-weighted moving average indicator
The (VWMA) main advantage is that it helps identify solid points of entry in a trend. In a nutshell, you don't have to use the (VWMA) in conjunction with any other indicator. The (VWMA) indicator can stand on its own two feet as each price is weighted with its volume.

In simple terms
The volume-weighted moving average (VWMA) gives the moving average (SMA) greater importance to "volume" by weighing prices with respect to "trading activity" in a predefined period of time. Define the time period & you are halfway there.

Here's the crunchy bit
The value of this indicator increases when the goldilocks, length, & offset, are sharply coded. Define those two preferences & it's all over red rover. Here's the kicker, during periods of low trading activity, the values of simple moving averages (SMA) & the volume-weighted moving average (VWMA) are almost similar. Knowing this can be used to your advantage.

Skate.
 
during periods of low trading activity, the values of simple moving averages (SMA) & the volume-weighted moving average (VWMA) are almost similar. Knowing this can be used to your advantage.

The VWMA indicator (bearish trend)
When the (VWMA) is below the (SMA) refers to a "bearish trend". Why is this so important? It's because the trend lacks the support of the volume. This lack of volume leads to the weakening of the bullish trend.

The VWMA indicator (bullish trend)
Trending markets are somewhat the reverse. When the (VWMA) is above the (SMA) indicates a bullish trend, a trend we can take advantage of. The main advantage of "volume" in combination with a simple moving average (SMA) adds significant importance for trend identification. It's worth remembering not all trends have equal value.

Skate.
 
Markets make a difference when it comes to profitability
Some indicators work better in certain market types but the volume-weighted moving average (VWMA) works in all types of markets. How does it do that? The (VWMA) picks its time to punch, meaning it's very selective when entering a position. Being selective means the indicator will only take "signals in trends" that are "confirmed to be bullish". As I said in my previous post a "bullish trend" is confirmed when the (VWMA) is above the (SMA). Using the same length of both indicators is critical for this confirmation.

Historical data
Using historical data is crucial when it comes to understanding the different types of market phases. When backtesting a (VWMA) strategy, great care should be exercised to note when the "VWMA Strategy" perform well. This step is important during the strategy development phase because this will indicate what has worked in the past & what's the probability it will work in the future.

Skate.
 
Markets make a difference when it comes to profitability
Some indicators work better in certain market types but the volume-weighted moving average (VWMA) works in all types of markets. How does it do that? The (VWMA) picks its time to punch, meaning it's very selective when entering a position. Being selective means the indicator will only take "signals in trends" that are "confirmed to be bullish". As I said in my previous post a "bullish trend" is confirmed when the (VWMA) is above the (SMA). Using the same length of both indicators is critical for this confirmation.

Historical data
Using historical data is crucial when it comes to understanding the different types of market phases. When backtesting a (VWMA) strategy, great care should be exercised to note when the "VWMA Strategy" perform well. This step is important during the strategy development phase because this will indicate what has worked in the past & what's the probability it will work in the future.

Skate.
An issue:

Screen Shot 2022-11-13 at 2.29.16 PM.pngScreen Shot 2022-11-13 at 2.29.38 PM.png

Can sometimes runaway on you.

Just for general interest, this is the strategy that the US MMs use to fill big orders for Mutual Funds etc. It is early in a trend a pretty safe entry point as it usually means there will be big buyers alongside.
jog on
duc
 
Just for general interest, this is the strategy that the US MMs use to fill big orders for Mutual Funds etc. It is early in a trend a pretty safe entry point as it usually means there will be big buyers alongside.

@ducati916 you beat me to it.
I was just writing about this very subject of how big players use this simple indicator. The takeaway I hope readers understand is how we can take advantage of the (VWMA) unique properties. I've managed to code the indicator to avoid positions that exhibit low volume in relation to the movement in price

Use the search feature
If others want to search, @ducati916 has made a series of posts about why "volume+price" in combination reveals an important story. That is the basis of what I've written about today

Skate.
 
It's easy to take advantage of (VWMA) indicator
This indicator is simple yet powerful & as there are many ways to skin a cat, & there are plenty of "potential ways" to use the (VWMA) indicator to your advantage. It is a little-known fact that some of the biggest traders around incorporate the (VWMA) indicator in their own particular trading.

Using the (VWMA) indicator in isolation
The bigger traders I'm referring to wouldn't use this indicator in isolation as I have. The brief from @rcw1, confirmed by "Bruce Lee" was to have a simple strategy with next to no moving parts. I've discussed earlier that if you can get the goldilocks parameters implemented the (VWMA) will not only be a breeze to trade but you will end up having a simple handy strategy to add to your collection.

Optimizing (VWMA) parameters is critical
If you put the effort into using optimizing the parameters the odds are greatly increased allowing you to get the maximum benefit from this indicator. I'm absolutely positive with more time I could improve this strategy, but for today, time is important as I want to conclude this series of posts.

Skate.
 
The (VWMA) Strategy
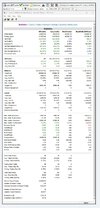
I backtested the strategy from the 1st of January 2020 to cover the COVID-19 period. The results aren't too shabby. Exposure is low, & so is the drawdown. Overall this strategy has a good expectancy which is always a bonus.

VWMA 1.jpg
In Summary
At face value, this would be a handy strategy. Out of curiosity, I might backtest this over a few different time frames. This calendar year has been tough, no doubt about it, even the "Turnkey WTT Strategy" has struggled with a simple 20-period breakout. I'll do a few backtest to confirm how it performs.

Skate.
 
The (VWMA) Strategy
I backtested the strategy for this calendar year from the 1st of January 2022 to the 11th of November 2022. The results are okay. Exposure is still low, but so is the drawdown. Overall this strategy has a good expectancy which is always a bonus.

VWMA 2022 1.jpg

Skate.
 
I finally got around to playing with the ZigZag indicator to end this matter once and for all.

I used GB's percentage of .00001.

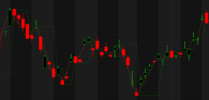
Below is a snip of BHP. The Orange line is the Vanilla zigzag, The Green is zigzag with modified future data. In general the signals are delayed by a day when future data is modified.

I wrote the current bar to all future bars and calculated the current zig, in my code it's nullify_condition=1. The horizontal sections in the green are where zigzag is using future data and doesn't know where the turning point is, so it's horizontal and not sloping. In some cases it's up to 6 days away before the turning point is detected and always with a lag. So even with such a low percentage it can still make a significant impact.


1668299369992.png

And here is the code i used It could prove usefull to others one day.

Code:
//*************************************************************
// Run an optimize on nullify_condition.
//    All 4 tests should show exact same results. If they don't, then there is a leak.
//    At the end, do a quick check to see if buy, sell signals have been messed with.
//
//    NOTE = This is just a quick helper. It does NOT prove there are problems, or prove your formula is safe.
//
//
//*************************************************************


_TRACE("Starting Test ");

futureLeakTest = True;    // use this to turn off the inner loop.

nullify_condition = Optimize("Future Null",1,1,4,1);     
                        // 1 = Future quotes == Current Close
                        // 2 = Future quotes == 0 (Zero)
                        // 3 = Future quotes == NULL
                        // 4 = Future quotes == unchanged.               

Buy = Sell = 0;

pr = .00001;
zzHiLo_test = Zig( c, pr ); // create an Original array to test against.

cc = Close;    // cache the close
for( i = 0; i < BarCount-1; i++ )
{
    C = cc; // Set the C back to the original.   
    
    //==============================================================================================
    if (futureLeakTest) // Inner loop
        for( t = i+1; t < BarCount; t++ )     // Loop through all future values From tomorrow onwards
        {                                    // Note we ONLY modify future values, which shouldn't be known or used.
            switch (nullify_condition)
            {           
            case 1:
                C[t] = C[t-1];    // Make future values non changing. ie, copy the last value. Usually the most stable.           
                break;
            case 2:
                C[t] = 0;        // Sometimes we want it to be zero, although this will upset calculations. This might be what you want
                break;
            case 3:
                C[t] = NULL;    // Sometimes just NULL it.  NOTE .. NULL and 0 are different in Amibroker, however most of the time produce the same results !!!
                break;
            case 4:
                break;            // C remains unchanged ie, do nothing. Will be the same as if
            }
        }       
// Put your base arrays, or other formula for looping here to be calculated and tested for future leaks.

    zz = Zig( C, pr ); // <== Note this is a modified Close array which Modifies future data.
    zzHiLo[i] = zz[i];
}

C = cc;

// zzHiLo = Zig( c, pr ); <= Doing in the loop now to modify future data
pk = zzHiLo>Ref(zzHiLo,-1) AND zzHiLo>Ref(zzHiLo,1); //<==== testing tomorrows Zig(close,pr)
tr = zzHiLo<Ref(zzHiLo,-1) AND zzHiLo<Ref(zzHiLo,1); //<==== testing tomorrows Zig(close,pr)
SetTradeDelays(1,1,0,0);
BuyPrice=SellPrice=C;
Buy = tr;
Sell = pk;

Filter = 1;
AddColumn(C,"C",1.6,IIf(C==C,colorBlack,colorRed));
AddColumn(zzHiLo_test,"ZZ1",1.6,IIf(zzHiLo_test==C,colorBlack,colorRed));
AddColumn(zzHiLo,"ZZ2",1.6,IIf(C==zzHiLo,colorBlack,colorRed));
AddColumn(zzHiLo - zzHiLo_test,"Delta ZZ",1.6,IIf(zzHiLo_test==zzHiLo,colorBlack,colorRed));

Plot(zzHiLo,"",colorgreen,styleLine);
Plot(zzHiLo_test,"",colororange,styleLine);

_TRACE("Completed test");
 
I finally got around to playing with the ZigZag indicator to end this matter once and for all.

I used GB's percentage of .00001.

Below is a snip of BHP. The Orange line is the Vanilla zigzag, The Green is zigzag with modified future data. In general the signals are delayed by a day when future data is modified.

I wrote the current bar to all future bars and calculated the current zig, in my code it's nullify_condition=1. The horizontal sections in the green are where zigzag is using future data and doesn't know where the turning point is, so it's horizontal and not sloping. In some cases it's up to 6 days away before the turning point is detected and always with a lag. So even with such a low percentage it can still make a significant impact.


View attachment 149167

And here is the code i used It could prove usefull to others one day.

Code:
//*************************************************************
// Run an optimize on nullify_condition.
//    All 4 tests should show exact same results. If they don't, then there is a leak.
//    At the end, do a quick check to see if buy, sell signals have been messed with.
//
//    NOTE = This is just a quick helper. It does NOT prove there are problems, or prove your formula is safe.
//
//
//*************************************************************


_TRACE("Starting Test ");

futureLeakTest = True;    // use this to turn off the inner loop.

nullify_condition = Optimize("Future Null",1,1,4,1);   
                        // 1 = Future quotes == Current Close
                        // 2 = Future quotes == 0 (Zero)
                        // 3 = Future quotes == NULL
                        // 4 = Future quotes == unchanged.             

Buy = Sell = 0;

pr = .00001;
zzHiLo_test = Zig( c, pr ); // create an Original array to test against.

cc = Close;    // cache the close
for( i = 0; i < BarCount-1; i++ )
{
    C = cc; // Set the C back to the original. 
  
    //==============================================================================================
    if (futureLeakTest) // Inner loop
        for( t = i+1; t < BarCount; t++ )     // Loop through all future values From tomorrow onwards
        {                                    // Note we ONLY modify future values, which shouldn't be known or used.
            switch (nullify_condition)
            {         
            case 1:
                C[t] = C[t-1];    // Make future values non changing. ie, copy the last value. Usually the most stable.         
                break;
            case 2:
                C[t] = 0;        // Sometimes we want it to be zero, although this will upset calculations. This might be what you want
                break;
            case 3:
                C[t] = NULL;    // Sometimes just NULL it.  NOTE .. NULL and 0 are different in Amibroker, however most of the time produce the same results !!!
                break;
            case 4:
                break;            // C remains unchanged ie, do nothing. Will be the same as if
            }
        }     
// Put your base arrays, or other formula for looping here to be calculated and tested for future leaks.

    zz = Zig( C, pr ); // <== Note this is a modified Close array which Modifies future data.
    zzHiLo[i] = zz[i];
}

C = cc;

// zzHiLo = Zig( c, pr ); <= Doing in the loop now to modify future data
pk = zzHiLo>Ref(zzHiLo,-1) AND zzHiLo>Ref(zzHiLo,1); //<==== testing tomorrows Zig(close,pr)
tr = zzHiLo<Ref(zzHiLo,-1) AND zzHiLo<Ref(zzHiLo,1); //<==== testing tomorrows Zig(close,pr)
SetTradeDelays(1,1,0,0);
BuyPrice=SellPrice=C;
Buy = tr;
Sell = pk;

Filter = 1;
AddColumn(C,"C",1.6,IIf(C==C,colorBlack,colorRed));
AddColumn(zzHiLo_test,"ZZ1",1.6,IIf(zzHiLo_test==C,colorBlack,colorRed));
AddColumn(zzHiLo,"ZZ2",1.6,IIf(C==zzHiLo,colorBlack,colorRed));
AddColumn(zzHiLo - zzHiLo_test,"Delta ZZ",1.6,IIf(zzHiLo_test==zzHiLo,colorBlack,colorRed));

Plot(zzHiLo,"",colorgreen,styleLine);
Plot(zzHiLo_test,"",colororange,styleLine);

_TRACE("Completed test");
Since you're using BHP daily, what would be a date where you'd argue it references future data and affects a backtest result? Just so I can run bar replay and check for myself.
 
Question round images.jpg

To set the record straight
Someone "Fucknuckle" has lifted the avatar from my ASF profile page & made a Twitter profile to make it "look like it's me". I can assure everyone it's not me & I don't have a Twitter account.

Twitter
I have just started reading Twitter recently. If I find something of "interest" I'll post it in this thread as I'm always on the lookout for new content. If a topic interests me it might interest others.

For a start
1. I don't have a Twitter account
2. I don't post on Twitter
3. I don't know Mo Bigun
4. I don't have any social media accounts

Thinking look.jpg

I have no idea what's going on
Twitter doesn't make much sense to me as it appears to be full of fluff with self-promotion. The content is not all that valuable IMHO but I'm sure it's an inexpensive way to sell goods & services.

I have no association with any of these posts
I have lifted the screenshots from Twitter to display how childish some can be. In essence, you have no control over false information being tweeted.

Twitter.jpg

Skate.
 
Since you're using BHP daily, what would be a date where you'd argue it references future data and affects a backtest result? Just so I can run bar replay and check for myself.
Any date period.

If you do an optimize, it will run all 4 backtests. Each of the first 3 tests modifies the future data, the 4th test doesn't modify the future data.

The 1st and 4th test will tend to be close because it copies the current bar to all the bars in the future. Hence the straight lines.

EDIT:
I think a bar replay will take a VERY long time with a 2 nested loops.
 
View attachment 149180

To set the record straight
Someone "Fucknuckle" has lifted the avatar from my ASF profile page & made a Twitter profile to make it "look like it's me". I can assure everyone it's not me & I don't have a Twitter account.

Twitter
I have just started reading Twitter recently. If I find something of "interest" I'll post it in this thread as I'm always on the lookout for new content. If a topic interests me it might interest others.

For a start
1. I don't have a Twitter account
2. I don't post on Twitter
3. I don't know Mo Bigun
4. I don't have any social media accounts

View attachment 149179

I have no idea what's going on
Twitter doesn't make much sense to me as it appears to be full of fluff with self-promotion. The content is not all that valuable IMHO but I'm sure it's an inexpensive way to sell goods & services.

I have no association with any of these posts
I have lifted the screenshots from Twitter to display how childish some can be. In essence, you have no control over false information being tweeted.

View attachment 149178

Skate.
Your coding will take me a while to understand, if I even get to that point. So that's a bit of a difficulty for me.

If tomorrow's close is higher than today's (by any amount), then today is a trough...and vice versa. In what situation would this not be the case? Like a specific date where a trough occurs on BHP and it's not possible to safely buy the following day's close.
 
To set the record straight
Someone "Fucknuckle" has lifted the avatar from my ASF profile page & made a Twitter profile to make it "look like it's me". I can assure everyone it's not me & I don't have a Twitter account.

Responding to a Twitter question
Just to clarify, I do not intend to open a Twitter account.

Responding to another Twitter question
Yes, I'm currently having a good year. Trading good strategies help in this regard.

Skate.
 
Responding to a Twitter question
Just to clarify, I do not intend to open a Twitter account.

Responding to another Twitter question
Yes, I'm currently having a good year. Trading good strategies help in this regard.

To set the record straight
Someone "Fucknuckle" has lifted the avatar from my ASF profile page & made a Twitter profile to make it "look like it's me". I can assure everyone it's not me & I don't have a Twitter account.
Skate.
Good afternoon/evening Skate,
Twitter may not be able to afford the Royalities for your mullet going across the planet ha ha ha ha ha ha ha
Hate that when that happens.... ha ha ha ha ha

Have a very nice night.


Kind regards
rcw1
 
Top