Australian (ASX) Stock Market Forum

Dump it Here

Your coding will take me a while to understand, if I even get to that point. So that's a bit of a difficulty for me.

If tomorrow's close is higher than today's (by any amount), then today is a trough...and vice versa. In what situation would this not be the case? Like a specific date where a trough occurs on BHP and it's not possible to safely buy the following day's close.

I have done all i can

This topic is closed.
 
UPDATE 3.jpg

Well, someone not happy
It appears I've offended someone who is on Twitter. Someone is making up fake Twitter accounts. What does it achieve? it doesn't make any sense?

My ASF avatar has been lifted from my profile page
It is a simple procedure to find out who has accessed my profile page. I'll request this information from @Joe Blow.

#  ANOTHER.jpg

Skate.
 
'tis a curious thing, that there exist some, oblivous to the fact, that, they have publically declared their personal ignorance, by thinking they've delivered an insult, when what they've actually delivered, is, in reality, an unintended compliment in disguise.
 
@DaveDaGr8 Have you looked at my code yet?

I did look at it last week, but I haven't run anything on it to actually TEST for future leaks. It's still a work in progress and i'm trying to see how to make it work the best with looping code.

The 2 main actors inside loops are

Code:
x = y[i+1];
// Calculating data using tomorrows ( unknown ) data. This is also something you can do outside loops using ref(c,1);

Code:
Buy[i-1] = 1;
// Changing a previous value in an array based on todays data. Something you can really only abuse in loops.

However, your code isn't doing either of those 2 things. So provided you' have some sort of trade delays it looks good to me.

The only 3 errors i found were

Code:
trailArray[ i ] = 0.8*H;   <=== I assume this is H[ i ]

But I'm guessing the forum software did that. If you click on the 3 dots ( more options ) and wrap code up in code blocks it won't try and format it.
 
ahhh...got it. Thanks. Here it is again.


function flipper_func(trail) { trailArray[ 0 ] = C[ 0 ]; for( i = 1; i < BarCount; i++ ) { prev = (round(100*(trailArray[ i - 1 ])))/100; if (C[ i ] > prev AND C[ i - 1 ] > prev) { trailArray[ i ] = Max(prev,0.8*H[ i ]); } else if (C[ i ] < prev AND C[ i - 1 ] < prev) { trailArray[ i ] = Min(prev,1.2*L[ i ]); } else if (C[ i ] == prev AND C[ i - 1] < prev) { trailArray[ i ] = 0.8*H[i]; } else if (C[ i ] == prev AND C[ i - 1 ] > prev) { trailArray[ i ] = 1.2*L[ i ]; } else if (C[ i ] < prev AND C[ i] > 1.2*L [ i ]) { trailArray[ i ] = 0.8*H[i]; } else if (C[ i ] > prev AND C[ i] < 0.8*H [ i ]) { trailArray[ i ] = 1.2*L[i]; } else if (C[ i ] < prev AND C[ i - 1 ] > prev) { trailArray[ i ] = 1.2*L[ i ]; } else if (C[ i ] > prev) { trailArray[ i ] = 0.8*H[ i ]; } else if (C[ i ] < prev) { trailArray[ i ] = 1.2*L[ i ]; } else { trailArray[ i ] = 1.2*L[ i ]; } } return trailArray; } trail = 1; trailArray = flipper_func(trail);
 
It's easy to take advantage of (VWMA) indicator
This indicator is simple yet powerful & as there are many ways to skin a cat, & there are plenty of "potential ways" to use the (VWMA) indicator to your advantage. It is a little-known fact that some of the biggest traders around incorporate the (VWMA) indicator in their own particular trading.

Stimulating ideas
As a member found my last series of posts on the (VWMA) indicator interesting I posted the results of today's trading to motivate him to look at this indicator in more depth. The "Dump it here" thread allows me to post to stimulate interest in systems that make money or have the potential to make money. I've used the VWMA indicator in some of my strategies with outstanding performance. As the percentage buy filter was on with the Index Filter also on, the strategy was worthy of a flutter today.

Today was a flat day but profitable
The reason I'm posting actual results is to display that the "VWMA % Strategy" has potential. Even though today was flat, there were positions worth pursuing.

TODAY.jpg


Fridays VWMA signals
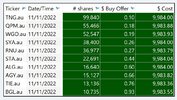
These are the signals from the VWMA Exploration Analysis from Friday. They are posted so anyone can chart the positions. Having the analysis displayed in the manner below makes trading effortless. Meaning it displays the (a) ASX code to buy, (b) the number of shares to buy, (c) the pre-auction buy offer price with (d) the total (maximum) investment to buy that position. The trading plan is just as lean having few rules.

VWMA.jpg


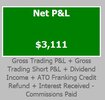
Today's net profit

VWMA $ results.jpg


VWMA Open Positions
Positions condensed for clarity.

VWMA Open Positions Condensed.jpg


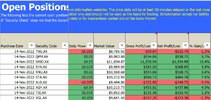
VWMA Open Positions
VWMA open positions expanded.

VWMA Open Positions.jpg


In Summary
I've posted today's results because a member found interest in my recent series of posts on the "VWMA indicator".

Skate.
 
The posts below somewhat highlight the dangers of systematic trading
Just these two posts alone explain why system trading at some stage will fail. The information they hold belongs in the pure gold category. When you read posts by experienced members it's time to prick your ears & listen. After reading these comments it should be a wake-up call in making sure "the systems" that you are currently trading are still fit "for purpose" otherwise you may experience heavy losses & a world of pain until the penny drops.

The issue that I have with mechanical systems and I suppose by extension the people that design them is that they, for the most part, seem to be blind to the intrinsic flaw that lies at the heart of mechanical based trading. Certain strategies will do well in certain market environments and potentially outperform their initial code. Markets change. Sometimes that change is subtle and the system still returns a profit, sometimes it is radically different and a period of underperformance will ensue.
[tossing] many systems currently being traded on the scrap heap.

One trap about out-of-sample testing that's easy to fall into is repeatedly using the same data sets. You test your system on in-sample data, looks great. You test it on out-of-sample data, it falls apart. What do you do? You go back to the system and make some adjustments. Test it again on the same data and it looks much better this time. But really, you've just made your out-of-sample data part of the in-sample data set. You can't keep making adjustments until the same out-of-sample test comes good.

In summary
If you believe the markets haven't changed, the trading environment certainly has.

Skate.
 
For those interested in all things Crypto
This short 8-minute YouTube video explains why the FTX collapse is a very expensive lesson for the crypto ecosystem. Michael Saylor explains how instability in the crypto space could add to bitcoin’s strength. It should also be noted that Michael Saylor is never short of an answer to progress Bitcoin.


Skate.
 
The posts below somewhat highlight the dangers of systematic trading
Just these two posts alone explain why system trading at some stage will fail. The information they hold belongs in the pure gold category. When you read posts by experienced members it's time to prick your ears & listen. After reading these comments it should be a wake-up call in making sure "the systems" that you are currently trading are still fit "for purpose" otherwise you may experience heavy losses & a world of pain until the penny drops.


In summary
If you believe the markets haven't changed, the trading environment certainly has.

Skate.
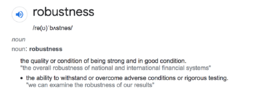
To me, robustness means having a system that:

1. Identifies different market regimes and trades accordingly, (eg. on/off index filter or dynamic position sizing)
2. Identifies factors in the market that are so deeply fundamental to the market that they must always function. eg. volatility expansion and contraction following each other like day and night.

I think if you have one or both of these, especially the second, you can mitigate the problems ducati mentions. Although exampes of the second are hard to find. What would be some other deeply fundamental factors that will always be functioning in the market?
 
What would be some other deeply fundamental factors that will always be functioning in the market?
Price movements in the short term will always reflect the current sentiment (emotions) of the collective crowd that's currently involved in the market. Extreme emotions such as fear and greed will produce the largest price swings.
 
To me, robustness means having a system that:

1. Identifies different market regimes and trades accordingly, (eg. on/off index filter or dynamic position sizing)
2. Identifies factors in the market that are so deeply fundamental to the market that they must always function. eg. volatility expansion and contraction following each other like day and night.

I think if you have one or both of these, especially the second, you can mitigate the problems ducati mentions. Although exampes of the second are hard to find. What would be some other deeply fundamental factors that will always be functioning in the market?

Screen Shot 2022-11-15 at 5.44.26 PM.png

What I think what we are talking about are tail events if you utilise a gaussian distribution.

Do I agree? Absolutely. In fact I would go further and state that not only withstand, but move to the enhanced position of profiting from the tail events.

Bedrock fundamentals: they are changing.

Screen Shot 2022-11-15 at 6.01.07 PM.pngScreen Shot 2022-11-15 at 5.59.38 PM.png

In 1971, the US went off of gold and onto the petro-dollar system. This provided a huge (unimaginable) advantage to the USD. The USD is managed by the Federal Reserve (a private bank) enabled by US legislation in 1913.

Since 1971 the market adage: 'Don't fight the Fed' has been the way to success in the markets.

So the Russian/Chinese and assorted allies, which are now de-dollarising, are breaking that US monopoly that has held world currencies in thrall and by extension (and most importantly) capital flows.

Given that the Arab world despise P. Biden, the move of OPEC+ to de-dollarise, removes the advantage that the US has enjoyed through the ability of the Fed. to dictate world monetary policy through the USD and Fed policy.

Markets (seem) not to have noticed fully, that the Fed. is finished. Paper, which has dominated since 1971, is about to be supplanted by real commodities, pre-dominantly energy.

From the above charts, you can see that there were 2 failed attempts at creating a Central Bank for the US. When they finally succeeded, of course it wasn't called a bank at all.

A free market, is a far more rangebound market (on aggregate) than a manipulated or controlled market. A controlled market is always inflationary as governments are profligate wasters of our paid taxes and always require more funding.

So the situation today is that the US must inflate. Or default. They will inflate (default over time) and to such an extent that they could actually destroy the USD as a currency, much as did the Weimar Republic, again, due to debt levels being unmanageable.

Inflation destroys the ability of businesses to efficiently allocate capital. Take 1 example: FIFO v LIFO accounting. In an inflationary environment, FIFO gives the impression of significant profitability. LIFO can result in losses or reduced margins. Of course the FIFO is illusion. Capital is likely being consumed.

So you say, well a mechanical system ignores financial statements, leaves that boring task to others and we just follow our model. Well of course the model is badly broken and results in tail events increasing as expected results are not even close to reality.

This results in a 1970's style market:

Screen Shot 2022-11-15 at 6.17.25 PM.png

Rangebound.

Of course, eventually Triffin's paradox took hold, allowing the Fed via the USD and UST reserves world wide, to take control of capital flows. There have been different primary providers: Europe (abdicated by creating the Euro) Japan and most recently China. The last resort is now the Fed itself, which is of course the end game for USD.

jog on
duc
 
Sailing the Good ship HMAS Skate

Well Done Captain Skate
I have updated and Verified each and every Starting Price---------------------- Friday 11th Nov 2022 OPEN logs

Well Done!
Apologies for the Logs below
I am hopeless with Computers , Copy and Paste


CodePurchase DatePurchase Price ($)Last ($)UnitsMarket Value ($)Profit / Loss ($)Change (%)icon-news.pngicon-bell.pngActions
WGO
11/11/2022​
0.180​
0.215​
52547​
11,297.605​
1,839.145​
19.44​
icon-news.png
icon-bell.png
BUY | SELL
AGY
11/11/2022​
0.620​
0.700​
15127​
10,588.900​
1,210.160​
12.90​
BUY | SELL
QPM
11/11/2022​
0.170​
0.180​
55466​
9,983.880​
554.660​
5.88​
icon-news.png
BUY | SELL
STA
11/11/2022​
0.435​
0.455​
22691​
10,324.405​
453.820​
4.60​
BUY | SELL
BGL
11/11/2022​
0.875​
0.890​
10735​
9,554.150​
161.025​
1.71​
BUY | SELL
RNU
11/11/2022​
0.265​
0.265​
36977​
9,798.905​
0.000​
0.00​
BUY | SELL
TNG
11/11/2022​
0.090​
0.090​
99840​
8,985.600​
0.000​
0.00​
BUY | SELL
ALG
11/11/2022​
0.580​
0.570​
16640​
9,484.800​
-166.400​
-1.72​
BUY | SELL
TIE
11/11/2022​
0.760​
0.745​
13136​
9,786.320​
-197.040​
-1.97​
BUY | SELL
SYA
11/11/2022​
0.255​
0.235​
38400​
9,024.000​
-768.000​
-7.84​
icon-news.png
icon-bell.png
BUY | SELL
Total
98,828.565
3,087.370
3.225
As I see it
She was extremely kind to you on the open Friday the 11th Nov 2022
I have seen this before many times

XYZ Yacht.GIFBUT almost never for ME!
 
Last edited:
Sailing the Good ship HMAS Skate

Well Done Captain Skate
I have updated and Verified each and every Starting Price---------------------- Friday 11th Nov 2022 OPEN logs

Well Done!
Apologies for the Logs below
I am hopeless with Computers , Copy and Paste


CodePurchase DatePurchase Price ($)Last ($)UnitsMarket Value ($)Profit / Loss ($)Change (%)View attachment 149299View attachment 149300Actions
WGO
11/11/2022​
0.180​
0.215​
52547​
11,297.605​
1,839.145​
19.44​
BUY | SELL
AGY
11/11/2022​
0.620​
0.700​
15127​
10,588.900​
1,210.160​
12.90​
BUY | SELL
QPM
11/11/2022​
0.170​
0.180​
55466​
9,983.880​
554.660​
5.88​
BUY | SELL
STA
11/11/2022​
0.435​
0.455​
22691​
10,324.405​
453.820​
4.60​
BUY | SELL
BGL
11/11/2022​
0.875​
0.890​
10735​
9,554.150​
161.025​
1.71​
BUY | SELL
RNU
11/11/2022​
0.265​
0.265​
36977​
9,798.905​
0.000​
0.00​
BUY | SELL
TNG
11/11/2022​
0.090​
0.090​
99840​
8,985.600​
0.000​
0.00​
BUY | SELL
ALG
11/11/2022​
0.580​
0.570​
16640​
9,484.800​
-166.400​
-1.72​
BUY | SELL
TIE
11/11/2022​
0.760​
0.745​
13136​
9,786.320​
-197.040​
-1.97​
BUY | SELL
SYA
11/11/2022​
0.255​
0.235​
38400​
9,024.000​
-768.000​
-7.84​
BUY | SELL
Total
98,828.565
3,087.370
3.225
As I see it
She was extremely kind to you on the open Friday the 11th Nov 2022
I have seen this before many times

View attachment 149297BUT almost never for ME!
Dear Captain,
as i understand it, the system analysis is performed on Friday and the actual purchase performed at open on Monday.
As such, the purchase date should be the 14/11 with the matching price: so for example SYA opened at .25 and TIE opened at .74-> the latter being a win so far, etc
Sorry ...
 
Well, this is interesting
The crypto exchange FTX saga continues. According to the Financial Times, FTX had less than $US1 billion in liquid assets against $US9 billion in liabilities before it went bankrupt. With the collapse of the FTX exchange customers scrambled to withdraw around $US5 billion in funds amid rumours of a liquidity crisis. This is the equivalent of a run on a bank.

Alameda Research
Regulatory probes in the US have now turned their attention to the central role of Alameda & its 28-year-old CEO Caroline Ellison. The YouTube video below has gone viral because of the flippant response from Caroline Ellison. In the interview about Alameda’s trading, Caroline Ellison said she could “absolutely pull it off without my math degree”. “You use very little math, you use a lot of, like, elementary school math,” she said.

Risk management
Caroline Ellison goes on to say, “Being comfortable with risk is very important. We tend not to have things like stop-losses, I think those aren’t necessarily a great risk-management tool. I’m trying to think of a good example of a trade where I’ve lost a ton of money … well, I don’t know, I probably don’t want to go into specifics too much.”

Yield farming
Caroline Ellison said jokingly she was sceptical of yield farming which was a risky trading strategy that became one of Alameda’s biggest moneymakers. For those who don't know, Yield farming involves investing in cryptocurrencies that pay interest-rate-like rewards. Such tokens often have an initial run-up in price before crashing. For me, a lot of it was just about readjusting my expectations & being open to whatever happened. I think like every week or so something weirder than the previous week would happen.”

This YouTube video is a real eyeopener
When watching this short video clip, I'm sure you'll laugh along with Caroline unless you have money involved with the exchange.


Skate.
 
This is a Mystery to me
What did Friday the 11th Pre-Market Calls mean on Captain Skates logs?
Did he Suggest opening price on Friday 11th or Monday 14th?

Only the Captain Skate himself can answer!
XYZ Yacht.GIF
 
This is a Mystery to me
What did Friday the 11th Pre-Market Calls mean on Captain Skates logs?
Did he Suggest opening price on Friday 11th or Monday 14th?

@Captain_Chaza over the last 4 years I've explained exactly how I trade as well as my trading rules.

I should have made this clearer from the get-go
I trade weekly systems with no manual interference. The buy & sell signals are triggered "after the close" on Friday. These signals are then placed in the pre-auction at the offer price that has a 3% premium to Friday's closing.

Just to confirm
All the signals are generated on Friday after the close. The signals are entered into Monday pre-auction. The date in the Amibroker Exploration Analysis is the date the report is generated. I generate the reports after the close on Friday & both, Buy & Sells are entered over the weekend waiting to snag the opening price on Monday. If the price "gaps" above the added premium of 3% I won't get settled. I don't chase the price.

Why after the close
All my research has been conducted under these test conditions. Trading the pre-auction using the (-/+ 3%) premium takes all the guesswork out of trying to time the purchase. Even with my conditional order placed in the pre-auction, you still run the risk that the position may fail to execute because of a gap-up. Something you have asked before.

I often repeat myself to reinforce a point
Sometimes reading it once it's hard to understand how I trade. Both entries & exits are always placed for Monday's pre-auction using the (+/- 3% premium). The 3% premium will either secure the opening price or it won't. A "buy order" not being executed has no consequence or bearing on the profitability of long-term strategy holding 10 or 20 positions in the portfolio.

Skate.
 
Top