Australian (ASX) Stock Market Forum

Dump it Here

The Simple Strategy.jpg

Skate's "Simple Strategy"
This exercise was to develop a strategy, but not any strategy but a strategy that is built on the entire premise of buying into the strength of a confirmed trend. The name of the strategy is unremarkable but at least it fully explains what the strategy is all about, "Simplicity". I'm over reading all the gurus telling me "ways to trade" but over the years I've found keeping a trading strategy simple is the way to go. I wanted to code the simplest strategy I could using only a few moving parts. The strategy uses the (ADX & ROC) buying into strength.

The "Simple Strategy" - "simply" buys into strength
When it comes to evaluating the "strength of a trend" the average directional index (ADX) is good as any to determine it. It's a simple idea of making sure that the (ADX) is greater than the previous 3 consecutive periods. The "Volume" over an "nPeriod" needs to be increasing as well. A stand-alone (ROC) filter is a primary guide kicking the (ADX) into gear. The PositionScore is entirely dependent on the ROC.

New ideas
The exercise was to throw a new trading idea out there so I could make a series of posts but to my surprise this simple idea isn't too shabby at all. So "what the heck" I'll live trade it instead.

Instead of posting
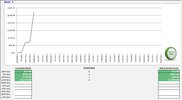
I greedily started to trade the "Simple Strategy" with the other 4 strategies. Trading the Simple strategy came after I had made the equity Chart for the combined 4 strategies so I placed it on its own worksheet.

Trading the Simple Strategy is motoring along
It's early days but I can't wait till the strategy is full. Being very selective with what it buys it will take a few weeks to fill the strategy. (Only 9 positions in the portfolio so far)
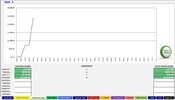
Simple Capture.JPG

Keeping it simple
No more than a few indicators & a handful of filters & "Bob's your uncle" a simple strategy to add to my trading stable.

Skate.
 
Market Index Marketing email (NOT SPAM)
I subscribe to receive emails from "Market Index" (meaning the email is not spam). I've just received a marketing email that includes a Whitepaper Available for Download in (PDF). The PDF discusses how their "Top 5 Portfolio" is constructed & their methodology how they rotate those positions on a monthly basis. The ROC indicator is their primary source for entry selection that would be interesting to a few.

Click here to read the Whitepaper (PDF)

ASX Top 5 Methodology Revealed
The ASX Top 5 Portfolio’s success has generated a flood of emails, so they say. So, Market Index has released a Whitepaper revealing the stock selection methodology. It similar to advertisers saying the sale had been extended "DUE TO POLAR DEMAND" - it's just a spiel & to be taken with a grain of salt.

The PDF outlines behind the scenes look at the ASX Top 5's:
• Strategy design
• Stock selection process
• Testing methodology

Think this email might interest someone you know?
Feel free to forward it on...

Their methodology
IMHO, it leaves a lot to be desired & the drawdown would be "un-stomachable" for most. But in their defence their "Amibroker code" is propriety & not subject to scrutiny.

Skate.
 
Proof reading
I apologise for not proof reading my post. No wonder @AussieStockDawg had a laugh.

ASX Top 5 Methodology Revealed
The ASX Top 5 Portfolio’s success has generated a flood of emails, so they say. So, Market Index has released a Whitepaper revealing the stock selection methodology. It’s similar to advertisers saying the sale had been extended "DUE TO POPULAR DEMAND" - it's just a spiel & to be taken with a grain of salt.

Skate.
 
what are you using as a tracking software program for trades and data @Skate ?

@TechnoCap there are 3 pieces of software I couldn't live without as a trader:

(1) AmiBroker
(2) Norgate data
(3) Share Trade Tracker.

Share Trade Tracker
I use "Share Trade Tracker" as my portfolio manager & have so for many, many years. The reports displayed in the "Dump it here" thread are generated using "Share Trade Tracker".

Share Trade Tracker update
It's a real shame that the development of STT has been halted. If anyone is interested in obtaining a copy of STT - I suggest you send a request to support@xlautomation.com.au & mention you are a member of the Aussie Stock Forum.

XLAutomation consulting services
XLAutomation still provides consulting services to supply a copy of the Share Trade Tracker workbook. Their minimum consulting charge is 2 hours @ $140/hr (ex GST) & for that cost, you would receive a copy of the STT workbook & one serial key to activate the product. There is "No Support" offered as part of this charge. If in the future you do require support to enhance or fix an issue then this would incur further consulting service costs.

So here is the deal
Contact the email address support@xlautomation.com.au if you want to purchase this consulting service & receive a copy of Share Trade Tracker. (The total cost is $280 excluding GST)

Skate.
 
Hey skate, we were talking about swing trading before and I've actually managed to get one right for a change so I thought I'd post it over here too as it seems the right thread for it:


And here's your scalp:

3333333.jpg

Sold 50/175 at the resistance level, sold 25 more earlier today at about +6% for the day (so about +15% from the buy), it topped out at about +9% for the day but I'm going to continue holding.

You'll see that NRGU (and there's been plenty of others, DPST, BNKU et al, no need to post 30 different graphs) clipped resistance (and thus sold) the afternoon of the day before SOXL's plummet to support too, marking the high of one corresponding with the low of the other beautifully (just like through the madness we saw in march):

44444.jpg

Considering the week this has been and fridays generally see profits taken even when things are more certain I wouldn't be surprised to see a big flip tomorrow again.

Plenty of swing plays yet!
 
Plenty of swing plays yet!

@over9k, would you like to explain (a) how you find swing trade candidates & (b) how you go about exiting a swing position.

ASX
Also, would it possible to post charts using the Australian market so I test your methodology. Using the ASX would be easier to understand & follow for most of the readers of this thread.

Skate.
 
Morning Mr Skate. I have been monitoring this thread along with Mr @peter2 thread through this very choppy May, which has been pretty rough due to the absence of a market trend which has broken or interrupted sector trends. In a word: messy.

A trend will re-establish itself, whether in sectors or the over-all market. It could well be lower, although it looks as if we may scrape higher and re-establish the Bull trend for a while longer. Either way some (obvious) lessons.

(i) Established trends are easy to see.
(ii) Beginning trends are hard to see.
(iii) Ending trends take time to see.

2 versions require you to give up something on the entry, or exit. Only (i) pays you nicely. So nicely that it more than compensates you for (ii) and (iii).

Of my 3 new positions today: IHF is a (ii), PJP is a (ii) and GOOG is not even a (ii). GOOG is an outright speculation, a crossed fingers and hope for the best trade. The point being, spotting the trend emerging lays the probabilities slightly in your favour.

So what is the point of this post?

The point is in hindsight, I would have not even bothered trading the last 3 weeks had I known in advance what was coming. Starting a new strategy in May would and has been a challenge. The lessons are contained in (i) - (iii) above, as the market at the beginning of May gave us (iii), reversed into (ii) back into (iii) and is again sitting at (ii). Alternatively, we could have recognised (iii) exited and still be waiting for an easy (i) to appear.

Given that we did not actually do that, far too boring, then we must act quickly and cut the losses fast, reverse long to short back to long again without overthinking things. The chop costs money, for sure. The trick, is to know when to stop churning and let a new trend that establishes itself to ruuuuuuuuuuuuuun. If you have issues with that, then you must give up returns while you wait for (i). Net-net it probably works out about the same in $. What the impact on your nerves are might be a different story.

So congratulations on posting the red days. Many, when looking at losses just stop looking. No-one likes looking at red. Red is a market reality. There are periods where red is all that you see. Obviously, ignoring it is not the answer. Red is information. Red may well sit within the plan/strategy. When it sits outside the plan is when action needs to be taken, which again, necessitates an understanding of where you sit in terms of (i) - (iii).

Just FYI June looks much better!

Screen Shot 2021-05-22 at 7.34.37 AM.png

jog on
duc
 
The point is in hindsight, I would have not even bothered trading the last 3 weeks had I known in advance what was coming. Starting a new strategy in May would and has been a challenge.

Summary
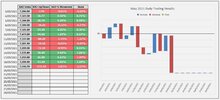
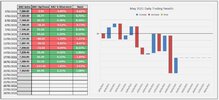
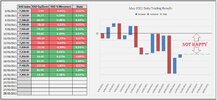
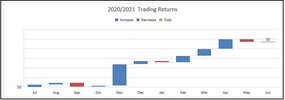
My trading results for the month of May have been horrendous dollar-wise as trading is always relevant to the size of your portfolio. In the scheme of yearly results "down months" are to be expected but not welcomed.

Being positive
This means I believe there are better days ahead. I have one week left in May to redeem myself.


Waterfall Capture.JPG


Strategies
Trading a variety of strategies helps in a small way to smooth my trading results. Like every other trader, I'm at the mercy of volatility.

Skate.
 
Starting a new strategy in May would and has been a challenge.

The "Simple Strategy"
@ducati916, your statement above is absolutely correct. I'm fully accepting that there is never a good time to start a new strategy but I have a theory. Buying into a depressed market "buys value" knowing the stringent requirements needed to be a buy candidate in not only this strategy but all my strategies. (FYI - I don't use an index filter in the buy statement)

Starting date
Luck & timing plays a significant role when starting a new strategy. The starting date can have a big bearing on the performance of the strategy in the short term but should settle over the longer term. As they say "there is never a good time to start trading" & traders need to be aware of the significance of "luck" when deciding to take the plunge.

Early days
I started the "Simple Strategy" in the last week of April so I would have positions to trade in the first week of May. Looking at the early results from 9 positions is heartening.

Monday
There is only one buy for Monday & at this rate, it will take weeks to fill this portfolio.


Simple Strategy Capture.JPG


Skate.
 
The point is in hindsight, I would have not even bothered trading the last 3 weeks had I known in advance what was coming.

Playing the pokies
Those who play the pokies have a habit of only telling you about their wins & never what they have lost. I started 5 new strategies in the last week of April so there would be positions to trade in the month of May.

3 Strategies are doing okay
The other two are struggling but recovering. Overall, my trading in May is underwater "at the moment" but I'm expecting something to happen next week. I just don't know if it will be good or bad.

If I have a good week
I might be able to break square for May but a bad week will drive me further into the red.

My "FreeBalling Strategy"
This strategy started a bit slow with two up weeks & two down weeks - but now the strategy is in minor profit. It's early days with 13 open positions with four new positions to be entered on Monday.

FreeBalling Capture.JPG

Skate.
 
Sunday at 4:32 PM
just looking at ESPO, this is close to a bottom. I wouldn't be buying it tomorrow, (17th MAY 2021) it needs to build some technical structure, but this is potentially close to an excellent entry point. It's now on my watch list.

Quick Update (ESPO)
As @ducati916 had displayed an interest in (ASX:ESPO) it's worthy of a weekend update. The Duc remarked that "I wouldn't be buying it tomorrow, (17th MAY 2021) it needs to build some technical structure". Good call.

The "Ducati Daily Blue Bar Strategy"
Duc was correct in not to calling a buy on Monday (17th April 2021) as the "Ducati Daily Blue Bar Strategy" generated a signal on the (20th May 2021) with an entry on the open the very next day (21st May 2021). I'm not saying that this entry will be a winner but taking each & every signal gives the best chance of profitability overall. The "Ducati Daily Blue Bar Strategy" gets it right more often than not.


ESPO Capture.JPG


Skate.
 
The other two are struggling but recovering. Overall, my trading in May is underwater "at the moment" but I'm expecting something to happen next week. I just don't know if it will be good or bad.

For transparency (losers)
The resurrected "HappyCat" & "BlueWren" strategies are starting to turn around which is pleasing & expected.

Performers so far (winners)
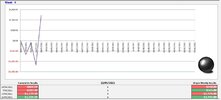
The "Simple Strategy", the "RubikCube Strategy" & the "FreeBalling Strategy" are all "currently" kicking into gear.

Combined Capture.JPG
Skate.
 
The Bee Strategy
This strategy is a solid performer & was named as it has a "sting in its tail" but the graphic looks ordinary. The naming of the strategy is important to me (not that it describes the inner working of the strategy) but as a way of differentiating between them - a picture paints a thousand words.

I should rename the "Bee Strategy"
@qldfrog has a new strategy "The Flying Bat Strategy" - what a great name. Living on the coast we have the nightly migration of Bats & the logo looks fiercer than my "Flying Pelican Strategy" & the "Bee Strategy".

"The Flying Bat Strategy"
The "Flying Bat" logo is much, much better than the "Bee & Pelican" put together.

Bee Strategy Capture.JPG

Skate.
 
Top