Australian (ASX) Stock Market Forum

Dump it Here

Skate, I respectfully decline your request.

I don't think you're quite getting what systematic trading is at all. It's not about taking a few indicators, turning them into rules and testing them. Sure, it would spit out some figures but they give you zero confidence of anything other than me (or anyone else) can turn a few words into a single programmed system. I actually might have programmed up your system earlier in this horribly long thread but your inability to acknowledge massive failings in your so-called systematic trading has worn my patience too thin.

Maybe once you've done that a few hundred times with different ideas, you might start gleaning insight into some aspects of systematic trading, but it's not a great approach.

Systematic trading invlves a lot more skill development and knowledge acquisition.

It's actually about consider understanding how markets operate, stationarity, trend following, mean reversion, arbitrage, correlation (or otherwise) of trading instruments, pairs trading, arbitrage, seaonality, behaviours of different cross-sections of the market, behaviours of securities in different phases of their life and different market regimes, incorporating lessons on risk events (try studying securities and markets that are crashing, or commodities in limit down situations), understanding degrees of freedom, consider how different allocation methods work and "risk of ruin" calculations. You'll definitely need to learn some level of statistics (or, at least, statistical concepts). You'll need to understand what biases you have have used - quite possibility invalidating your entire system or making the results meaningless. The list of things to is of course much broader - consideration of stops, hedging, trade length, your time availability and ability to execute trades, optimizations, in and out-of-sample testing, data quality, survivorship bias, and much more.

This is a very iterative process - you will rework your systems many times over, as your skill and knowledge increases. Understanding the way different styles of trading systems trade, including trade frequency, serial correlation of trades, volatility of returns and other metrics, will add to your knowledge further.

Rinse and repeat this many times over for the ultimate systematic trading goal: Trading multiple low correlation trading systems that, overall, work well in many different market regimes, with a upwards trending equity curve with minimal dradowns.

This will takes a minimum of a few years of effort and experience - likely more.

So, with that, I leave you to actually learn systematic trading, rather than talking about what it might be with no real basis for those statements. Good luck.
 
Some information/resources in addition to those mentioned by me here:

The ATAA has a Quant Traders Special Interest Group, which is quite well attended, and many presentations these days are quant in nature - some of the recent conferences have had great presenters on this topic, some of which you can find on Youtube too (eg Clement, Starke, Reid, to name a few that presented recently). Quantopian has re-formed as a quantitative community and has some great presentations. Sydney Cybertraders.

As with any of these presentations, and people on podcasts, they have done the hard yards and actually learned system trading so their presentations are the product of many years of effort. They also simplify their presentations to suit the audience - you certainly can't teach systematic trading in one hour.

I know many of these people and interact with them regularly - their actual systems are more nuanced, but at least it gives you some ideas of things to contemplate in your (multiple) trading model development.
 
Systematic trading invlves a lot more skill development and knowledge acquisition. I don't think you're quite getting what systematic trading is at all. I actually might have programmed up your system earlier in this horribly long thread but your inability to acknowledge massive failings in your so-called systematic trading has worn my patience too thin. Maybe once you've done that a few hundred times with different ideas, you might start gleaning insight into some aspects of systematic trading, You'll definitely need to learn some level of statistics (or, at least, statistical concepts). This will takes a minimum of a few years of effort and experience - likely more. So, with that, I leave you to actually learn systematic trading, rather than talking about what it might be with no real basis for those statements.

Acknowledgment and Appreciation
@Richard Dale, I trust I’ve captured all the key points from your previous post. I sincerely appreciate your comprehensive insights into the complexities of systematic trading. The additional information in your thread, “Resources for Systematic/Algorithmic Trading,” is invaluable and will undoubtedly provide the practical principles we’ve discussed, enabling a more concrete exploration of strategy evaluation.

Steps in Systematic Trading
I truly appreciate the depth of your explanations and the wealth of knowledge you’ve contributed to our discussion. Many of us, myself included, have undertaken similar steps as you highlighted - backtesting, optimisations, in and out-of-sample testing, exporting results into Microsoft Excel for further analysis and plotting scatter charts and equity curves to better understand the metrics.

Confidence from Rigorous Processes
Believing in the rigorous processes, especially during my time with Norgate’s Platinum Subscription, has given me the confidence to start live trading. While those with more experience and qualifications might achieve even better results, I firmly believe that thorough testing instils the confidence needed to elevate a system to the next level and actively trade it.

Evolution of Trading Tools
Just as Norgate Data has evolved from Legacy to a proprietary data format, traders at all levels strive to elevate their game, gaining more experience and refining their strategies over time. I’m fortunate to have a good memory, and despite lacking formal coding experience, formula language makes sense to me.

Personal Trading Journey
Trading has been rewarding for me, largely due to the strategies I’ve employed. My coding skills have also evolved, from writing a few lines of code to creating comprehensive charts with expanded Exploration Analysis reporting. Developing features like the “StaleStop,” “PercentageUp Buy Filter,” and a multilevel trailing stop has added another level to my trading, allowing me to trade in the pre-auction with extensive use of looping techniques.

Sharing Knowledge and Ideas
Over the years, I’ve been fortunate to use this thread to share my knowledge which has significantly aided in my trading. By suggesting new ways of thinking about the markets, I’ve posted numerous ideas and concepts, even if they haven’t always been perfect. For those who crave basic ideas to kickstart their trading journey, this thread serves as a starting point.

Skate.
 
@divs4ever, for the next week, I’ll be sharing a “Quote of the Day” that ties into and enriches our ongoing discussion about backtesting and the associated risks in trading.

Skate.
 
@divs4ever, for the next week, I’ll be sharing a “Quote of the Day” that ties into and enriches our ongoing discussion about backtesting and the associated risks in trading.

Skate.
now one way to reduce delisting risks is to select a share ( or a distinct basket of shares , NOT an index )

sure you still have interference factors like stock buy-backs , consolidations and cap. raisings also like any historical data , back-tests should be used as a GUIDE and even a forensic research tool to the viability of a system ( that system might excel in certain unusual circumstances )

but just remember all those risks still exist in the future
 
1. AI v Human Logo.jpg
Explanation
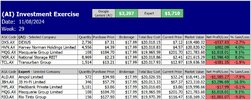
This is a theoretical investment exercise comparing the stock selections of expert fund manager Dr. Don Hamson and Google (AI) Gemini. Both have provided their top 5 growth and income stocks for the ASX over the next 12 months.

Results after 29 weeks

1st Place $3,297: Google Gemini (AI) - RED line on the equity chart (3 winning positions)
2nd Place $1,710: Dr. Don Hamson (Expert) - BLUE line on the equity chart (2 winning positions)

2. SummaryResult.jpg


3. WeeklyUpdate.jpg

Skate.
 
This was around the time I started it as a paper trade. I could have corrected it later on but rather than muck up the experiement I left it the same. Call it a bit of luck but here it is nothing to hide.

Just goes to show if you can pick the stocks you can do well even with long trading in a not so good market conditions.

If you traded in and out of the those stocks you could have trippled that figure, as they were in the negitive many times over the last few months.


1723339823329.png
 
I quite enjoy reading academic papers related to predictions on index movements, cross-sectionals, biases, pre/post events, etc. and seeing if there's anything I can statistically correlate to current markets.
Let me address the quote about correlations
Correlations refer to the statistical relationship between two or more variables. By identifying these relationships, traders can potentially reduce their risk and increase returns. Understanding correlations can help traders identify momentum, which can be used to enhance the effectiveness of a trading strategy, potentially leading to higher returns and lower risk.

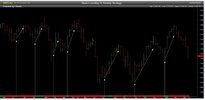
The “PercentageUp Buy Filter”
The sole focus of the “PercentageUp Buy Filter” is to serve as a buy timing mechanism for determining "when to buy", rather than "what to buy". This filter helps traders identify the optimal moments to enter the market based on the percentage of stocks in a watchlist that have closed higher than their open price. By doing so, the "buy filter" aims to enhance the timing of buy decisions, potentially improving the trading strategy's overall effectiveness and profitability.

PercentageUp Buy Filter XAO Chart.jpg

Skate.
 
Top