Australian (ASX) Stock Market Forum

Dump it Here

Big New Capture.jpg
Heads Up for “Share Trade Tracker” Users
A new version, of Share Trade Tracker, is expected to be released tomorrow. This update will rectify the current issue with fetching Yahoo free data for “End of Day Prices”.

Skate.
 
Following my above post may be you will ask me how can I get VUL, MSB, FND, DRO, RCR, and the rest bunches of stocks? I scan the whole market with this modified RoAR and at the exploration window I use scan from period. All ingredients are inside that binary spikes include RoAR indicators, indices, and how Activ trade (finds its stock candidate; I almost overlook this part). The only thing I don't use is MMA.

A typical swing system and not so busy trade. trigger will be based on this momentum indicator. exit will be 20MA only. Simple!

1722861032356.png
 
Knowing When to Change the Conversation
Recognising when to shift the topic is crucial in any discussion, and there are a few key indicators that I watch for. If my posts fail to resonate, there will likely be a lack of questions or comments, signalling little interest in the current topic. This is a clear sign that it’s time to change direction.

Additionally, when alternative views devolve from helpful criticism into personal attacks, continuing the conversation becomes unproductive. If the discussions become polarised, it’s often best for me to steer towards a new topic. By staying mindful of these telltale signs, I can remain positive and engaging, as my goal is to connect, not divide. So, I shift gears to maintain a constructive flow.

Skate.
 
Our Beliefs Are Very Tribal
It’s a given that we are all tribal. Rather than agreeing to disagree, many members are increasingly caught up in a kind of tribal fight where both sides exacerbate the sense of anger by reacting to everything. When a tribe member expresses a view, we tend to elevate their position because of our perceptions. The “Dump It Here” thread is not a contest of ideas but a community where alternative ideas are shared.

The “Dump It Here” thread aims to facilitate this process by encouraging members to question their assumptions, challenge their beliefs, and think outside the box. It’s a gradual process that ultimately leads to better decision-making abilities. This thread reflects our commitment to providing a space where members can exchange diverse ideas and experiences.

Skate.
 
The Importance of Listening to Alternative Views
People often tend not to listen to alternative views. Your predefined beliefs typically determine whether you agree or disagree with them. However, if you don’t listen, you forgo the right to understand their point of view.

Listening doesn’t mean you have to agree, but it does mean you respect the other person’s right to be heard. This approach not only broadens our own understanding but also helps bridge divides and build a stronger community.

Skate.
 
Moving Beyond the “Signal Generator”
In the past, I’ve discussed and shared the parameters of my “Signal Generator” strategy. However, I’ve decided to move on from that and focus my attention elsewhere.

My original plan was to track the performance of three MACD variations, incorporating valuable suggestions from forum members @peter2, @DaveTrade, and @DrBourse. The goal was to enhance the overall performance of these strategies, believing they held significant promise.

Additionally, I was going to introduce another MACD-based strategy, the “MACD Advanced Breakout Strategy.” Unfortunately, the previous MACD-related strategy hasn’t been as well-received as I had hoped.

By moving beyond the “Signal Generator” and the “Enhanced Signal Generator,” I’ll now focus on the “MACD Advanced Breakout Strategy” trading approach.

Skate.
 
The Advanced MACD Breakout Strategy
The “Advanced MACD Breakout Strategy” is a comprehensive trading approach that combines multiple technical indicators to generate buy and sell signals. Rest assured, I won’t be posting ongoing results. This advanced strategy utilises the MACD indicator with customisable fast, slow, and signal periods, along with a smoothing and normalisation period to fine-tune the signals.

Basic Overview
The “Advanced MACD Breakout Strategy” incorporates a 200-period simple moving average (SMA) to determine the overall trend, ensuring trades are made in the direction of the prevailing market trend. Additionally, the Relative Strength Index (RSI) is used to filter trades based on overbought and oversold conditions, with specific thresholds set for bullish and bearish signals. Volume conditions are also considered, requiring the current volume to exceed the average volume multiplied by a specified factor.

The “PercentageUp” Buy Filter
The “Advanced MACD Breakout Strategy” calculates the percentage of days the close price is higher than the open price to gauge market sentiment. This percentage must exceed a bullish threshold for buy signals or fall below a bearish threshold for sell signals. Buy signals are generated when the MACD signal line turns green, the trend is up, and "all filter conditions" are met.

The Exit Strategy
The Chandelier Stop, calculated using the Average True Range (ATR) and a multiplier, is employed to set exit points for trades. Conversely, sell signals are triggered when the MACD signal line turns red, the trend is down, or the price falls below the Chandelier Stop. The strategy plots buy and sell signals on the chart with arrows and labels, not “coloured bouncing balls,” to provide a clear and systematic approach to trading.

Skate.
 
The Advanced MACD Breakout Strategy Offers Several Benefits
The first two MACD strategies I’ve previously discussed provide valuable insights into the world of system trading. The “Advanced MACD Breakout Strategy” ratchets it up a notch by enhancing the accuracy of trading signals through the combination of multiple technical indicators, such as the MACD, SMA, and RSI. This multi-faceted approach helps filter out false signals and improves the precision of trading decisions.

Better Risk Management
The inclusion of the Chandelier Stop, using the Average True Range (ATR), helps set clear exit points for trades. This ensures that traders can protect their profits and minimise losses, leading to more effective risk management.

Trend Confirmation
Using the 200-period SMA to determine the overall trend ensures that trades are made in the direction of the prevailing market trend. This alignment with the broader trend increases the likelihood of successful trades.

Market Sentiment Analysis
The “PercentageUp” buy filter gauges market sentiment by calculating the percentage of days the close price is higher than the open price. This helps traders understand the underlying market conditions and make more informed decisions.

Summary

Overall, the “Advanced MACD Breakout Strategy” provides a systematic and comprehensive approach to trading, enhancing both accuracy and risk management.

Skate.
 
New academic paper.

The Three Types of Backtests. https://papers.ssrn.com/sol3/papers.cfm?abstract_id=4897573

Even if you are unable to follow the mathematics, the "systematic" simluations shown in this thread here are really quite sadly lacking. Some of the key takeways here that is not hard to incorporate many of these points at the starting point of a trading system.

The so-called "proven" "trading systems" presented in this stupidly-long thread (hint: create a new thread for each system, already) are sadly lacking.

I also note that all so-called "trading systems" appear have been snowflaked (discontinued reporting) on one day of negativity (where they gave up 2 months of gains in 1 day). Robust - nope!

To quote from the paper:

ENHANCING THE QUALITY OF HISTORICAL SIMULATIONS

In this section, we discuss how to increase the quality of a backtest by focusing on six areas
known to present challenges, namely: data quality, data representativeness, statistical integrity,
modelling and generalisation, costs and constraints, and performance evaluation.

Data Quality


Survivorship Bias
: Survivorship bias is defined as a type of selection bias that occurs
when analyses are conducted only on the data that have survived a selection process while ignoring
those that did not. This bias can lead to skewed results and incorrect conclusions because the nonsurviving entities typically differ from the survivors in significant ways.

The impact of survivorship bias is particularly pronounced in the analysis of mutual and
hedge fund performances, as well as investment strategies. For example, including only those
funds that are still active at the end of the period can significantly overestimate the average fund
performance, as the worst-performing funds go out of business and are not reported on.

Point-in-Time Considerations and Restated Data: Point in time refers to ensuring that
data used in analysis or backtesting is reflective of the information that would have been available
to researchers at that specific point in time. This is particularly relevant in the case of restated data,
which involves adjustments made to previously reported financial figures, such as earnings,
revenue, or other financial metrics, due to errors, accounting changes, or compliance with new
accounting standards. Restatements can significantly alter historical financial statements, affecting
the accuracy of financial analysis and the models that rely on those statements. For practitioners,
it is essential to manage restated data carefully; this often means using a point-in-time database to
capture financial data as it was originally reported, without incorporating restatements or
adjustments made after the fact.

Incorrect and Missing Data: Incorrect data are any errors or inaccuracies in the dataset.
These inaccuracies can stem from various sources, such as data entry errors, issues with data
collection methods, or problems in data transmission. Before analysis, data should be thoroughly
cleaned, which involves checking for and correcting errors, ensuring consistency across datasets,
and verifying data accuracy against reliable sources.
Missing data occurs when information is absent from the dataset. This can happen for
various reasons, such as system errors, data corruption, or when the data was never recorded or
collected in the first place. Missing values can be imputed using assorted statistical techniques,
such as mean imputation or regression imputation, or more sophisticated methods like multiple
imputation or machine learning-based approaches. Depending on the context, forward filling may
be a good option to avoid introducing additional complexity through imputation. In some cases,
missing data can be augmented from alternative sources, although this approach requires careful
consideration to ensure the compatibility and reliability of the augmented data.

Dealing with Outliers: In the development of investment strategies, it is essential to
evaluate the role of outliers – that is to say, extreme values that deviate significantly from the rest
of the data. Strategies that capitalise on these rare occurrences might not be sustainable, as the
outliers may represent unique, non-recurring events. Consequently, relying on such anomalies
could lead to strategies that perform exceptionally well under specific conditions but fail to
generalise across different market environments.
When incorporating models that are inherently sensitive to outliers, such as linear
regression, care must be given to the nature and impact of these extreme data points. Practitioners
must ascertain whether outliers arise from errors in data collection or entry – such as misreported
financial figures – or if they reflect genuine market phenomena that could offer valuable insights.

Data Representativeness

Sample period selection bias is the primary concern in the area of data representativeness.
This type of bias occurs when the time frame chosen for a backtest inadvertently influences the
results, leading to conclusions that may not be robust across different market conditions or time
periods. When designing all-weather investment strategies (Lopez de Prado 2019), it is essential
to include data from a wide range of market conditions rather than periods of optimal performance
alone. This ensures the strategy's robustness across different market cycles. However, when
creating tactical investment strategies, which, as Lopez de Prado (2019a) describes, are designed
for specific market conditions, it may be more appropriate to select targeted time frames. The MinTrack-Record-Length algorithm described by Bailey and Lopez de Prado (2012) can help
determine the number of observations needed to validate a strategy's effectiveness across diverse
market scenarios.

Statistical Integrity

Data Mining and Data Snooping: The concepts of data mining and data snooping refer
to the process of searching through large datasets to identify patterns, relationships, and trends that
can be used to develop investment strategies. This approach to strategy development should be
avoided, as it very easily leads to selection bias through the improper application of data analysis
techniques to uncover patterns in data that appear to be of statistical importance. Data snooping
(p-value hacking) involves researchers repeatedly probing various subsets of data or conducting
5 numerous tests (potentially on the same data) until they achieve a result that seems meaningful
(White 2000; Sullivan, Timmermann, and White 1999).

Accounting for Selection Bias under Multiple Testing: Backtests need to account for
the number of trials run and their statistics so that a discount measure can be applied to the
performance metrics (Lopez de Prado 2018, 2020). This is covered in greater detail in the next
section.

Modelling and Generalisation

Look-Ahead Bias: Look-ahead bias is the mistake of using data from the future as if it
were point-in-time data to make investment decisions. We separate this from the problem of not
using point-in-time data as we define it because of the research process. This approach can lead to
inflated performance metrics and unrealistic expectations as to the profitability of investment
strategies.
Most typically, this mistake is made by not applying the appropriate lag to the indicators
or signals. It also commonly occurs when computing statistics on the entire data sample rather than
a rolling computation – for instance, using the entire sample when computing the mean and
standard deviation of a z-score to normalise a signal.

Introducing an Embargo Period: An embargo period is a hold-out sample of data, a test
set, typically the most recent two to three years. Practitioners should fit models and make design
choices regarding their trading strategies based on the in-sample period, and once the strategy is
ready to be validated, the results can be produced for the embargo period. Any market anomaly
that was exploited in the training set should also be present in the embargo period.

Costs and Constraints
An oft-overlooked step is the incorporation of trading costs and the constraints relating to
short selling and liquidity.

Transaction Costs: Neglecting to account for transaction costs leads to a higher false
positive rate. Higher turnover strategies incur greater expenses, necessitating a more substantial
return to be viable. Omitting these costs from an evaluation leads to inflated performance metrics.
Borkovec and Heidle (2010) provide a good introduction to the types of costs and their
impact on trading. Notably, they split costs into three types. The first, brokerage costs, are easily
estimated using historical data and include commissions and fees; two examples of fees are
custodial and transfer fees. The second, trading costs, consist of four components: delay costs, bidask spread, market volatility/trend costs, and market impact. Finally, opportunity costs are the
costs of not completing the full order. The authors highlight that market impact has the highest
cost (and is difficult to model), whereas commissions and spread have the lowest effect and are
easily estimated. Transaction costs can be estimated either empirically, using historical data, or
analytically by attempting to build a model.

The paper continues in more detail.

I'm sure we'll continue to see more platitudes/motherhood statements posted in this thread.

The "wisdom" provided that describes "false signals", "improving precision". "increasing likelihood of successful trades", "more informed decisions", "enhancing accuracy" etc. are unjustified and unproven platitudes. These platitudes seriously look like they're written with Chat-GPT.

Either stop using such unproven (or unprovable) statements or provide empirical/statistical proof incorporating aspects of this paper, or I will continue to call out this practice of poor terminology.

If you hadn't guessed it, I'm all for the scientific method and will call out poor/bad science when I see it.
 
FYI, my summary posted into private forums for other systematic traders:

Interesting July 2024 paper incorporating lots of prior research on backtesting, backtesing quality, Monte Carlo, Sharpe plus risks related to selection bias, type I (rejecting null hypothesis/false positive) and type II (false negative) errors. de Prado is (5th) co-author.

 
If you disagree with someone please don't attack or insult them, but present your argument or alternative view in a polite and respectful way. This leads to constructive discussion and debate, while aggression and personal attacks lead to nothing but off topic posts, so please think very carefully before you post.

@Richard Dale let me address some of your statements:
#1. "The so-called "proven" "trading systems" presented in this stupidly-long thread (hint: create a new thread for each system, already) are sadly lacking"

My Response to Richards's First Statement
@Richard Dale in a previous post, I listed every time I used the word "proven" and its context. I have never claimed that the systems I posted about are "proven": https://www.aussiestockforums.com/threads/dump-it-here.34425/post-1291439

Skate.
 
I also note that all so-called "trading systems" appear have been snowflaked (discontinued reporting) on one day of negativity (where they gave up 2 months of gains in 1 day). Robust - nope!

#2. "I also note that all so-called "trading systems" appear have been snowflaked (discontinued reporting) on one day of negativity (where they gave up 2 months of gains in 1 day). Robust - nope!"

@Skate # (1) I remain skeptical about using a one indicator system when all of the entries and exits are based solely on this one indicator. Usually this type of system doesn't perform well in all market conditions and therefore makes it dangerous for new traders to think that is all that they need to do to trade the markets, it could lead to big losses for new traders. If there is more to the system that you are using then this should be made clear to new traders. #(2) The danger, in my opinion, is if a new trader thinks that it's easy to develop a system like this that works consistently in all market conditions, then they may get themselves into trouble.

My Response to Richard's Second Statement
@Richard Dale, the reason for stopping the ongoing trade performance reports was twofold. First, there was little interest in the current topic, making it less engaging. Second, and most importantly, @DaveTrade warned that this "trading idea" could be dangerous for beginners, as he highlighted in his comments above.

Regarding the recent performance of the “two bouncing balls” Signal Generator system, the last two weeks reflect the current market sentiment, which even the best systems would struggle to navigate.

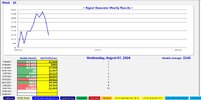
As of yesterday, the results are shown in the equity curve. I believe this "simple idea" holds value for beginners as an introduction to system trading. However, its value is limited if it doesn’t engage others.

The final post
This is only posted to confirm that the recent sell-off hasn’t been kind to this trading idea, nor millions of others.

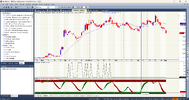
###1. 7th Auguest 2024 Open Summary after the massive sell off.jpg


###1. 7th Auguest 2024 Weekly Result after the massive sell off.jpg

Skate.
 
Last edited:
@Richard Dale let me address some of your statements:
#1. "The so-called "proven" "trading systems" presented in this stupidly-long thread (hint: create a new thread for each system, already) are sadly lacking"

My Response to Richards's First Statement
@Richard Dale in a previous post, I listed every time I used the word "proven" and its context. I have never claimed that the systems I posted about are "proven": https://www.aussiestockforums.com/threads/dump-it-here.34425/post-1291439

Skate.

Disagreement should be an opportunity for constructive and respectful debate that advances the discussion in a positive way. I hope that is what occurs in this thread. I would urge all participants not to let anger and/or frustration get the better of them.
 
I'm sure we'll continue to see more platitudes/motherhood statements posted in this thread.

The "wisdom" provided that describes "false signals", "improving precision". "increasing likelihood of successful trades", "more informed decisions", "enhancing accuracy" etc. are unjustified and unproven platitudes. These platitudes seriously look like they're written with Chat-GPT.

#3. "I'm sure we'll continue to see more platitudes/motherhood statements posted in this thread. The "wisdom" provided that describes "false signals", "improving precision". "increasing likelihood of successful trades", "more informed decisions", "enhancing accuracy" etc. are unjustified and unproven platitudes. These platitudes seriously look like they're written with Chat-GPT."

My Response to Richard's Third Statement
@Richard Dale I understand my writing and posting style may not appeal to everyone, and I’ve faced criticism before. We all have a unique way of expressing ourselves, and to some degree, we are all wordsmiths in our own right. My goal is to share trading knowledge I’ve found useful and to promote trading ideas, though I admit my approach may not always be universally accepted or preferred.

My intention is not to push any specific trading strategies but rather to foster constructive discussions around the exchange of ideas. I’m always looking to improve as a contributor to this forum. I welcome open, polite, and thoughtful critiques of my posts, as I’m here to learn as much as to inform.

I’ve made many posts to encourage members to share their alternative trading ideas, as trading can be confusing for all of us. Your contributions are meaningful, and I aim to keep you engaged.

Skate.
 
while i applaud Skate for trying to keep ideas simple
a novice should realize SOME professional traders succeed by taking LARGE risks

now the recent drop was blamed on 'the Japan carry-trade ' unwinding .. hint the BoJ only raised rates by 0.25% , normally a trader could have taken such a hit and unwound with acceptable losses , but most commentators i have heard 'guess ' the trading strategy was done with 5 times leverage !!

given some in the British Gilt ( Treasury bonds ) debacle ( causing the Bank of England to throw out lifelines ) were believed to be using 50 times leverage ( i have no idea how you sweet-talk that sort of deal out of your lender , but that MAY have happened )

trading by it's nature is risky enough , please assess your risk factors sensibly , there is always the potential for a downside event
 
Either stop using such unproven (or unprovable) statements or provide empirical/statistical proof incorporating aspects of this paper, or I will continue to call out this practice of poor terminology. If you hadn't guessed it, I'm all for the scientific method and will call out poor/bad science when I see it.

#4. "Either stop using such unproven (or unprovable) statements or provide empirical/statistical proof incorporating aspects of this paper, or I will continue to call out this practice of poor terminology. If you hadn't guessed it, I'm all for the scientific method and will call out poor/bad science when I see it".

My Response to Richard's Fourth Statement
@Richard Dale, as I mentioned earlier, I’ve decided to stop posting about the Signal Generator displaying “coloured bouncing balls” and have explained my reasons. I recognise your credentials and have acknowledged them. Your strong views are noted.

Who would have guessed
That a simple two-rule system could generate so much discussion? The rules are straightforward: buy the next day after a lime dot appears and sell the next day after a fuchsia dot. This idea was an entry into system trading, allowing new traders to evaluate and experiment with a structured approach.

TWO Coloured Dots System.jpg


The other colours
The “Red” and “Green,” dots are just confirmation dots and add nothing more than cosmetic value.

TWO Red and Green Coloured Dots System.jpg

Skate.
 
and for the novices .. a truly bad example

i will call this the lunatic knife-catching style

earlier this morning i picked up ( extra ) TEG , the order was for 0.7 cents but the market re-opened at 0.6 cents ( lucky me strikes again )

and will be looking to reduce @ 1.5 (ish ) ... eventually , and dilute previous losses ( i have held since 2011 )

now this will NOT ( in my prediction ) crystallize on overall profit , but if successful will dilute my losses in this stock ( and increase the holding )

... but the announcement was negative , and the market reaction came right at me , ( thanks sellers )
Have you ever wondered why you never seem to get positioned?

FWIW : Maybe if you move your decimal point might help?
Invest.jpg
 
Top