Australian (ASX) Stock Market Forum

Dump it Here

All I am Questioning is the Validity of the Smoke and Mirror Excel Values

@Captain_Chaza, It sounds like you’re questioning the accuracy or reliability of certain values. The term “Smoke and Mirror” suggests that you might think these values are misleading or deceptive.

Could you provide more details about the specific issue you’re facing with the Excel values? - For example, are you seeing unexpected results, or do you suspect that the data has been manipulated? This will help me understand your concern better and provide a more targeted response.

Skate.
 
Sorry Skates
I asked a simple question and You answered me with Tables upon new Tables

I can't decide if this is Garbage In / Burbage Out or you are onto something
 
Sorry Skates
I asked a simple question and You answered me with Tables upon new Tables

I can't decide if this is Garbage In / Burbage Out or you are onto something

@Captain_Chaza, your question was confusing and it didn’t make sense to me.

So there was no “Smoke and Mirrors” I posted the information so you could determine the information you were asking for.

To me it sounded like you’re questioning the accuracy or reliability of certain values.

The term “Smoke and Mirror” suggests that you might think these values are misleading or deceptive - or I was being misleading or deceptive.

Skate.
 
All I was asking is Why at 4.02 pm today WHY was your figures on ALL and RIO INCORRECT
To me that is Garbage In -Garbage Out

The Cover-Up is Smoke and Mirrors
 
All I was asking is Why at 4.02 pm today WHY was your figures on ALL and RIO INCORRECT
To me that is Garbage In -Garbage Out

The Cover-Up is Smoke and Mirrors

I have already answered that question, just a few posts back. The reply was directly under your post - here is the answer again:

@Captain_Chaza the charts posted at (4.02pm) were screen captures from early today and posted when I had time. Let me give you the updated information and charts after the close today.

As the screen capture was done earlier in the day, I did a new screen capture after the markets had closed for you to have a look at.

Here again are the EOD results.

2nd updare.png

Skate.
 
I only questioned the 1st Table you posted. All I was asking is Why at 4.02 pm today WHY was your figures on ALL and RIO INCORRECT. To me that is Garbage In -Garbage Out. The Cover-Up is Smoke and Mirrors. I asked a simple question and You answered me with Tables upon new Tables.

@Captain_Chaza, starting tomorrow, my updated weekly reports will be provided in a more condensed format, with clear date and time stamps. Given the multiple projects I currently have under evaluation, it has become challenging to determine which ones to prioritise for posting.

I have a total of 4 projects that I find interesting
However, I do recognise that the level of interest from others may vary. Moving forward, I will endeavour to strike a better balance between the projects that interest me and those that are interested in trading.

Skate.
 
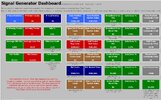
#1. Signal Generator.jpg
#1. Signal Generator Strategy
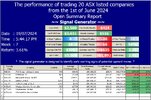
This is the first of three projects that I believe hold some value. I have shared the strategy with one of our members, and with their permission, I've shifted the discussion from a private message to this thread. This will allow me to answer any questions and provide additional information that may benefit others as well.

Typically, I have been posting the results of this strategy on Fridays after the market closes, allowing the review and ongoing system performance. However, as mentioned earlier, I will be providing these updates in a more condensed format, with clear date and time stamps, starting tomorrow.

Skate.
 
View attachment 181024
#2. Enhanced Signal Generator
The second strategy that I'm currently evaluating is the "Enhanced Signal Generator". This approach was developed with valuable input from several community members, including @peter2, @DaveTrade, and @DrBourse.

I'm particularly interested in exploring whether adding additional confirmational indicators can improve the accuracy of the signals generated by this strategy. My goal is to potentially enhance the overall performance while also reducing the frequency of the generated signals, which was a concern with the previous approach.

I believe this "Enhanced Signal Generator" strategy holds significant promise, and I'm eager to dive deeper into the analysis and testing. As with the first strategy, I plan to provide regular updates on the performance and findings in the condensed reports on Saturday morning.

Skate.
 
1. Trend Trading Logo.jpg
# 3 Trend Breakout Strategies
The third and fourth strategies I'm evaluating are very similar, with the primary difference being the size of the watchlist. The initial strategy involved a portfolio of 20 positions, but a community member recently reached out with interest in a more condensed version.

The "Breakout Strategy" caught this member's eye, but they felt that managing a 20-position portfolio was more than they could comfortably handle. As a result, they asked if the strategy could be adapted to a 10-position portfolio of his choosing instead. Recognising their preference, I proceeded to implement the strategy with his selected set of 10 companies from the original watchlist.

Given the member's interest in the more compact 10-position version of the "Breakout Strategy," I will now be focusing my reporting efforts on this streamlined approach. I will continue to maintain records and updates on the original 20-position strategy, but I will refrain from posting those in the thread to avoid overloading it with paper trading reports.

Skate.
 
Here is my plan for the upcoming posts
(a) I will continue to post the results of the original "Signal Generator Strategy" on Fridays after the market closes, as I have been doing. This will allow the review of the performance of this original exercise.

(b) On Saturday mornings, I will provide updates on the "Enhanced Signal Generator" strategy. This will enable a direct comparison between the original and the enhanced version, to evaluate the potential improvements in accuracy and overall performance.

(c) Finally, I will post the results of the "Breakout Strategy" with the 10-position, "10-company watchlist". This streamlined approach was developed based on feedback received, and I'm eager to assess whether this more compact trading strategy can be profitable.

By presenting the updates in this structured manner, I aim to display the progress and performance of these various strategies. This should help identify the most promising trading approach moving forward.

Skate.
 
#1. Signal Generator.jpg
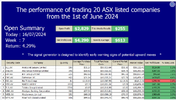
The Signal Generator Trading System
This hypothetical trading exercise is designed to trade 10 large ASX companies, selected from a watchlist of 20 companies. Buy and sell signals are generated daily, effective from the 1st of June 2024.

Portfolio Allocation
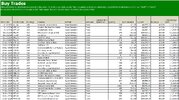
The (Signal Generator Portfolio) will be diversified across 10 holdings, with each position allocated $10,000, capping the total portfolio value at $100,000. This ongoing exercise aims to provide a clear assessment of the relative performance of this trading idea.

Simplified Reporting

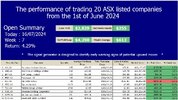
3. Open Summary.jpg


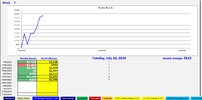
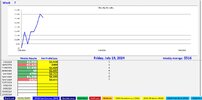
2. Weekly Results.jpg

Skate.
 
Last edited:
10. Enhanced Signal Generator.jpg
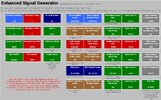
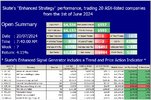
The Enhanced Signal Generator Trading System
This hypothetical trading exercise is designed to trade 10 large ASX companies, selected from a watchlist of 20. Daily buy and sell signals are generated, effective from the 1st of June 2024. The strategy leverages trend and price action indicators to control the frequency of signals, incorporating suggestions from forum members @peter2, @DaveTrade, and @DrBourse.

Diversified Portfolio Allocation
The Enhanced Signal Generator portfolio is diversified across 10 holdings, with each position allocated $10,000, capping the total portfolio value at $100,000. This ongoing exercise aims to provide a clear assessment of the relative performance of this trading strategy compared to the original "Signal Generator" approach.

Simplified Reporting
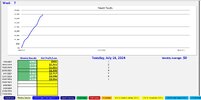
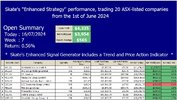
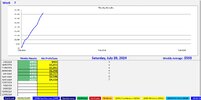
Having all the trading metrics on a weekly open summary provides an at-a-glance display of the ongoing results, adding a date and time stamp to indicate the snapshot in time.

13. Enhanced Open Summary.jpg


12. Enhanced Weekly Results.jpg

Skate.
 
View attachment 181129
The Enhanced Signal Generator Trading System
This hypothetical trading exercise is designed to trade 10 large ASX companies, selected from a watchlist of 20. Daily buy and sell signals are generated, effective from the 1st of June 2024. The strategy leverages trend and price action indicators to control the frequency of signals, incorporating suggestions from forum members @peter2, @DaveTrade, and @DrBourse.

Diversified Portfolio Allocation
The Enhanced Signal Generator portfolio is diversified across 10 holdings, with each position allocated $10,000, capping the total portfolio value at $100,000. This ongoing exercise aims to provide a clear assessment of the relative performance of this trading strategy compared to the original "Signal Generator" approach.

Simplified Reporting
Having all the trading metrics on a weekly open summary provides an at-a-glance display of the ongoing results, adding a date and time stamp to indicate the snapshot in time.

View attachment 181130


View attachment 181131

Skate.

Tha
View attachment 181129
The Enhanced Signal Generator Trading System
This hypothetical trading exercise is designed to trade 10 large ASX companies, selected from a watchlist of 20. Daily buy and sell signals are generated, effective from the 1st of June 2024. The strategy leverages trend and price action indicators to control the frequency of signals, incorporating suggestions from forum members @peter2, @DaveTrade, and @DrBourse.

Diversified Portfolio Allocation
The Enhanced Signal Generator portfolio is diversified across 10 holdings, with each position allocated $10,000, capping the total portfolio value at $100,000. This ongoing exercise aims to provide a clear assessment of the relative performance of this trading strategy compared to the original "Signal Generator" approach.

Simplified Reporting
Having all the trading metrics on a weekly open summary provides an at-a-glance display of the ongoing results, adding a date and time stamp to indicate the snapshot in time.

View attachment 181130


View attachment 181131

Skate.

@Skate that's the best equity curve I've seen, I know it can't keep going straight up but it's off to a good start.
 
Top