Australian (ASX) Stock Market Forum

Dump it Here

unlike say Benjamin Franklin

having meet several times an inventor who successfully locked up his patents , stealing patents is not solely a Chinese thing , several G7 companies deliberately tried to steal/subvert his patents

after all the West happily stole several Chinese icons around the 1900's

in fact we still call fine porcelain ... china

but what makes you think the Chinese are simply copy-cats there is plenty of abandoned superior tech to be reinvigorated
In my previous life pre covid as entrepreneur, only once have i seen my IP deliberately stolen, by a weight and scale international billion dollar company , a western one
So, a team of 2 guys, develop an innovative, not done before system, present it to the major player in the industry for a test, looking at collaboration, licensing etc, and they just rushed to their vietnamese in that case, programmer monkeys to copy the system.
They even dared asking us to send them the code to their Singapore office...for "testing"..rol..we did not and the bastards did never buy even a year licence, only a free month trial...repeated
On the other end, i have a dozen patents registered for work done during my startup in SZ period, and neither Huawei, Samsung or any other big players we were dealing with try any bastardy attempt.
I hope this overpriced billions scale and measure company dies and is replaced by a Chinese or even better their own Vietnamese subcontractor .
I would like go name the bastards but do not want to give trouble to Joe..or finding myself sued
Pm me if interested
 
Comparative Equity Curve Analysis
The displayed equity curve provides a comparative analysis of three trading strategies: (a) the original “Signal Generator”, (b) the “Enhanced Signal Generator”, and (c) the “10-Position Breakout Strategy”. This analysis aims to offer a clear assessment of the relative performance of each approach over time.

1. Original Signal Generator
Represented by the blue line, this strategy serves as the baseline for comparison.

2. The Enhanced Signal Generator
Shown as a dark red line, this strategy builds on the original signal generator with additional suggested enhancements.

3. 10-Position Breakout Strategy
Depicted in lime, this strategy focuses on breakout opportunities across ten positions.

Not enough detail on your actual entry and exit rules for any of us to ascertain anything here, and certainly not enough information on how you selected the 10 stocks. You are basically just showing how to compare 3 black box (opaque) trading systems.

With no backtesting, any thought to out-of-sample testing, universe selection etc. this is simply an exercise in plonking a trading system on an uptrending market.

The lessons learned here will be limited, at best, and probably misleading.
 
Not enough detail on your actual entry and exit rules for any of us to ascertain anything here, and certainly not enough information on how you selected the 10 stocks. You are basically just showing how to compare 3 black box (opaque) trading systems.

@Richard Dale, I always appreciate your input as it allows me to make additional posts with information I have neglected to detail. I normally post too much information that sometimes turns into a lengthy read. Let me answer your remarks over a few posts to separate each strategy so they aren't (opaque) trading systems.

Before I do this, I'll quickly answer your question about how the 10 stocks were selected. Originally, the idea was to track and share the progression of a hypothetical $100,000, "20-position portfolio" but a community member recently reached out with interest in a more condensed version.

The "Breakout Strategy" caught this member's eye, but they felt that managing a 20-position portfolio was more than they could comfortably handle. As a result, they asked if the strategy could be adapted to a "10-position portfolio" of his choosing instead. Recognising their preference, I proceeded to implement the strategy with "his selected set of 10 companies".

Given the member's interest in the more compact 10-position version of the "Breakout Strategy," my reporting changed to this streamlined approach.

My previous post can be found here

Skate.
 
Not enough detail on your actual entry and exit rules for any of us to ascertain anything here

1. Original Signal Generator
@Richard Dale Let me explain how the "Signal Generator Strategy" works and how it takes and exits positions.

(a) Inputs and Initial Values
The strategy uses settings to determine how quickly it should react to price changes and how long it should look back to make decisions.

(b) Calculations
It calculates two different averages of the price over time. The difference between these averages helps determine if the price is generally going up or down. This difference is then adjusted to make it easier to compare over different periods.

(c) Buy and Sell Conditions
# Buy Condition

The strategy decides to buy when the adjusted value is higher than it was in the previous period. This suggests that the price is starting to go up.

# Sell Condition
The strategy decides to sell when the adjusted value is lower than it was in the previous period. This suggests that the price is starting to go down.

# The Plotting
The strategy places coloured dots on a signal line to show where to buy and sell. A lime dot on the signal line indicates a buy tomorrow. A fuchsia dot on the signal line indicates a sale tomorrow. (A Lime Dot is a signal bar and a Green Dot is the execution bar)

# Strategy Execution
The first dot on the signal line is the "signal bar" and the next dot on the "signal bar" bar is the execution bar. When a signal appears, the buy is placed in the pre-auction to snag the opening price. When a sell signal appears, the next bar is the sell bar (the execution bar) the position is placed in the pre-auction to snag the next opening price which will be the selling price.

# The First Dot "Lime" (Buy Signal bar)
This lime dot appears when the strategy detects a good time to buy. Once the signal bar is generated you simply place the buy into the pre-auction to be purchased at the opening of the next trading day.

# The Second Dot "Green" (Buy Execution Bar)
This green dot shows the actual buy action. It is placed on the signal line to confirm the buy.

# The First "Fuchsia Dot" (Sell Signal Bar)
This fuchsia dot appears when the strategy detects a good time to sell. It is placed on the signal line to indicate a sell signal.

# The Second "Red Dot" (Sell Execution Bar)
This red dot shows the actual sell action. It is placed on the signal line to confirm the sale.

Why is the "Dot" system useful?
1. Simplicity: You don’t need to understand complex calculations or coding. Just follow the dots.
2. Visual Clarity: The dots make it easy to see when to buy and sell.
3. Consistency: The strategy follows a set of rules, so it takes the emotion out of trading.

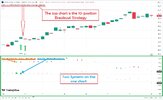
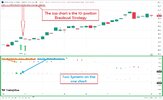
By following the coloured dots, you can easily see when to enter and exit trades, making the process straightforward and less stressful. This post talks about the strategy enclosed in the "Green Box" and the strategy is underlined with an "Orange Colour". The top signal line with the small coloured dots is the "Signal Generator Strategy" - the signal line below is the "Enhanced Signal Generator" that I will discuss in the next post.

TODAY - ALL.jpg

Skate.
 
Not enough detail on your actual entry and exit rules

(2) Enhanced Signal Generator
@Richard Dale Let me explain how the "Enhanced Generator Strategy" works and how it takes and exits positions.

Enhanced Signal Generator Strategy
The "Enhanced Signal Generator" is the same strategy as above but with suggestions for improvements by 3 forum members - @peter2, @DaveTrade, and @DrBourse. With their help, I reworked the original strategy and decided to run a comparison to determine how effective the suggestions play out.

# Inputs and Initial Values
Similar to the original strategy, it uses settings to determine how quickly it should react to price changes and how long it should look back to make decisions. Additionally, it includes a setting to determine the overall trend of the market using a simple moving average (SMA).

#Calculations
It calculates two different averages of the price over time and the difference between these averages. This difference is adjusted to make it easier to compare over different time periods. It also calculates the overall trend of the market using the SMA.

#Buy and Sell Conditions
1. Buy Condition: The strategy decides to buy when the adjusted value is higher than it was in the previous period. The adjusted value was lower two periods ago. The price is above the SMA, indicating an upward trend.

2. Sell Condition: The strategy decides to sell when the adjusted value is lower than it was in the previous period. The adjusted value was higher two periods ago. The price is below the SMA, indicating a downward trend.

# Plotting
The strategy places coloured dots on the chart to show where to buy and sell. A green dot indicates a buy signal. A red dot indicates a sell signal. Additional dots (lime and fuchsia) are used as the signal bar. The green and red dots are the action bar.

# Strategy Execution
When a lime dot appears, the strategy indicates a buy tomorrow. When a fuchsia dot appears, the strategy is signalling a sell tomorrow.

# Advantages of Following a Coloured Dot System
1. Simplicity: You don’t need to understand complex calculations or coding. Just follow the dots.
2. Visual Clarity: The dots make it easy to see when to buy and sell.
3. Consistency: The strategy follows a set of rules, so it takes the emotion out of trading.

By following the coloured dots, you can easily see when to enter and exit trades, making the process straightforward and less stressful.

TODAY - ALL.jpg

Skate.
 
Not enough detail

(3) 10-Position Breakout Strategy
@Richard Dale Let me explain how the "10-Position Breakout Strategy" works and how it takes and exits positions. I should also say that the requirement to trade 10 positions is not written in stone. The choice of 10 positions was made for practical reasons (a member's request) - it fits nicely with a $100k portfolio size and makes the metrics easy to track. However, the strategy could potentially be adapted to trade a different number of positions if that better suited the trader's preferences and account size.

The key point is that the portfolio has flexibility in the number of positions it holds. The size of the watchlist or index used makes little difference. The focus should be on executing the breakout trading strategy effectively, rather than strictly maintaining a fixed number of positions at all times.

This hypothetical trading exercise is designed to trade 10 large ASX companies, selected from a watchlist of 10. The results are from the 1st of June 2024. The breakout trading strategy aims to profit from price movements by identifying when prices break out from established levels.

# How the "10-Position Breakout Strategy" Works
This strategy is designed to identify and act on potential buying opportunities in the market, using a combination of breakout signals and volatility measures. Here's a step-by-step explanation:

1. Breakout Detection
The strategy looks for moments when the price breaks above the highest price of the last n-periods (let's call this the breakout period). This is a signal that the price might continue to rise. Conversely, it also monitors for when the price falls below the lowest price of another n-periods (let's call this the sell period). This indicates a potential downturn.

2. Volatility Measure
The strategy uses a measure called the Average True Range (ATR) to understand how much the price typically moves. This helps set levels for when to exit a trade to protect against losses.

3. Moving Average
It calculates the average price over a certain number of periods (n-periods). This helps determine the overall trend of the market. If the price is above this average, it suggests an upward trend, and if below, a downward trend.

4. Relative Strength Index (RSI)
The RSI is used to gauge whether the market is overbought or oversold. This helps avoid buying when the price is too high or selling when the price is too low.

5. Buy and Exit Conditions
(a) Buy Signal.
A buy signal is generated when the price breaks above the highest price of the breakout period. The current price is above the ATR stop level, indicating that the price is not too volatile. The current price is above the moving average, suggesting an upward trend.

(b) Sell Signal. An exit signal is generated when the price falls below the lowest price of the sell period. The current price is below the ATR stop level, indicating potential increased volatility.

6. Trade Management
The strategy keeps track of whether it is currently in a trade or not. It only enters a trade if a buy signal is detected and it is not already in a trade. It exits a trade if a sell signal is detected and it is currently in a trade.

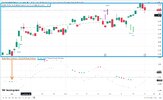
7. Visual Indicators
A lime "up arrow" indicates a buy on the next open. The Green up arrow appears below the price bars to indicate buy action signals.
(a) Buy Signals - A green "up arrow" appears below the price bars to indicate buy signals.
(b) Sell Signals - A red "down arrow" appears above the price bars to indicate sell signals.
(c) Connecting green line are drawn between buy and sell points to visually show the trade from start to finish.

8. Advantages of This Strategy
(a) Adaptability
- By using the ATR, the strategy adapts to different market conditions, adjusting its stop levels based on how volatile the market is.
(b) Risk Management - The combination of breakout signals, moving averages, and RSI helps filter out false signals and ensures trades are taken in favourable conditions.
(c) Automation - The strategy can be automated, allowing for consistent execution without emotional interference. This helps maintain discipline and stick to the trading plan.
(d) Visual Clarity - The use of coloured dots and connecting lines makes it easy to see when to buy and sell, making the process straightforward and less stressful.

By following these rules and visual cues, traders can systematically enter and exit trades, aiming to capitalise on market trends while managing risk effectively.

Breakout Strategy.jpg

Skate.
 
By following these rules and visual cues, traders can systematically enter and exit trades, aiming to capitalise on market trends while managing risk effectively.

Traders are unable to do this. You have not provided any quantifiable rules. You've mentioned n-period breakouts (n undefined), volatility measures (with no definition), n-period moving average where n is undefined, RSI where the lookback or smoothing algorithm is undefined, ATR stops where the multiplier is undefined etc.

Backtesting is impossible without defining at least these (and probably more).

It's time to stop dealing with vague (motherhood) statements.

You are clearly defining a systematic/algorithmic system (which you have clearly coded in PineScript) - post it here for others to test. Your diagrams are good to show when it happens - but the detail is clearly missing.
 
"Dot colours" - oh my.

It's time to stop dealing with vague (motherhood) statements.

@Richard Dale, I appreciate your engagement and feedback. However, I believe constructive criticism and mutual respect are essential for productive discussions. Negative comments or unreasonable requests without contributing positively to the conversation are not in the spirit of this thread.

Whenever I'm approached for help, I've simply replied that I promote trading ideas but don't supply code that can be evaluated. However, I've recently reconsidered this approach. Using TradingView allows me the opportunity to paper trade a strategy with posted weekly reports and if it turns out to be profitable I'm prepared to give those who ask after the exercise is finished so they can evaluate the strategies for themselves "cost-free". This provides a starting point, rather than politely refusing to share anything.

It's important to foster a community where we support each other and share knowledge. If you have specific questions or need further clarification on the strategy, I'm more than happy to provide additional details. Let's aim to keep our discussions constructive and helpful for everyone involved.

Skate.
 
Your results cannot be verified. Your trading rules cannot be verified.

As I have previously stated your trading systems are:
a) Without backtesing
b) Without defined rules
c) Without external verification

You appear to want to post here to help people with trading systems but can't/aren't willing to do a) b) or c) yet you promote a systematic approach to trading.

I've simply replied that I promote trading ideas but don't supply code that can be evaluated.

Reconsider your approach.
 
What if this signal generator proves to be effective
Once this signal generator approach has been proven effective, I'll make it available for anyone to evaluate. Releasing it before it has demonstrated its ability to generate consistently profitable trading signals would likely result in it being quickly discarded or lost among the myriads of other trading systems we tend to gather.

@Richard Dale, I appreciate the feedback you provided regarding the lack of quantifiable details in my previous posts about the "Signal Generator", "Enhanced Signal Generator", and "10-Position Breakout" strategies. You make a series of fair points that without clearly defining the specific parameters and rules, it is difficult for traders to properly backtest and evaluate the approaches.

As you noted, I mentioned various technical indicators like n-period breakouts, volatility measures, moving averages, RSI, and ATR stops, but did not provide the actual definitions for the 'n' values, lookback periods, smoothing algorithms, and multipliers used. Without these concrete details, backtesting the strategies becomes challenging. I understand your frustration with presenting vague, high-level information instead of a more systematic, algorithmic breakdown.

You are correct that I have coded these strategies in TradingView's Pine Script, and I am willing to share those details so others can analyse and test the approaches. I'm not primarily after someone to validate my coding or backtest results, as I'm more interested in doing that work myself and posting the ongoing live results so the community can follow along. If you review my previous posts, (Tagged above) you can see the commitment I've made to providing transparent, detailed information once the strategies prove to be profitable.

I genuinely appreciate your constructive feedback, as it will only help strengthen the quality of the information I'm able to provide. My goal is to foster an environment of collaborative learning, and I'm grateful when the community members take the time to push me to be more rigorous and transparent in my strategy explanations. Please feel free to continue providing this type of thoughtful critique - it will only serve to improve the strategies I'm able to share.

Skate.
 
OK - just do it. Don't wait until "this strategy proves to be profitable."

If you do, that's selection bias.
 
OK - just do it.

@Richard Dale, I want to reiterate my commitment to providing the full details of the "Signal Generator", "Enhanced Signal Generator", and "10-Position Breakout" strategies once they have proven to be profitable through paper trading.

This means that anyone interested in evaluating the approaches will be able to do so without any cost barriers. The data, software, and code will all be provided free of charge, allowing those interested to thoroughly vet the strategies.

Skate.
 
Do it now, instead.

You have provided no backtesting or reasoning behind your strategy.

If you are unable to do so, let others backtest it. Make this a community project if you are unable to do so.
 
"Dot colours" - oh my.

@Richard Dale, if I may, I wish to add to my previous comments to explain why the coloured dots system is the perfect strategy for those new to trading. I challenge you or anyone to showcase a more accessible trading system that beginners can easily follow and understand.

I'm just saying, that "The Signal Generator" can serve as an excellent starting point to system trading. The rationale behind the four-dot approach is to provide both anticipatory and confirmatory signals, which can help traders prepare their positions more effectively. Here's a breakdown of how the signal generator could work:

Lime Dot (Buy Signal)
The lime dot acts as a leading indicator, giving traders a heads-up to buy the position in the pre-market to secure the opening price.

Green Dot (Buy Dot)
This is the buy bar, confirming that traders should have already executed their buy positions on this bar.

Fuchsia Dot (Exit Signal)
The fuchsia dot gives traders a heads-up when to exit a position in the pre-market to ensure settlement at the opening price.

Red Dot (Sell Dot)
This is the sell bar, confirming that traders should have already exited their positions on this bar.

Just follow the coloured dots
A chart that displays only coloured dots helps eliminate any potential for confusion. This level of visual clarity and advance notice can be a game-changer for those new to trading. It allows them to enter the market with confidence, timing their trades to potentially capture favourable opening prices.

If you trust the signals
You will diligently follow the system.

DOTS.jpg

Skate.
 
Last edited:
I*'m just saying, that "The Signal Generator" can serve as an excellent starting point to system trading. The rationale behind the four-dot approach is to provide both anticipatory and confirmatory signals, which can help traders prepare their positions more effectively. Here's a breakdown of how the signal generator could work:

Yet you provide no details. Nebulous "dots" aren't details!
 
1. Do it now, instead.
2. Yet you provide no details

@Richard Dale, I appreciate your feedback and desire for more details. Let me address your comments:

"Do it now, instead."
I understand your eagerness to see the full details implemented right away. However, as I mentioned, I want to ensure the strategies are proven profitable through paper trading before releasing the full specifications. This is to protect both myself and any interested traders. I hope you can appreciate the need for thorough testing and validation before a full release.

"Yet you provide no details."
I believe I have provided a comprehensive overview of the core principles and mechanics behind the "Signal Generator" and related strategies. The breakdowns of the buy/sell signals, the colour-coded dot system, and the rationale for the anticipatory and confirmatory signals were all intended to give you a clear understanding of how the systems work.

My goal is to have an open and transparent exchange, but I also want to ensure I'm releasing information responsibly.

Skate.
 
I challenge you or anyone to showcase a more accessible trading system that beginners can easily follow and understand.

I'm unable to follow most meaningful aspects of your trading system despite 25 years of trading and coding experience with Metastock, TradeSim, AmiBroker, Python, Zipline, pysystemtrade, vector-bt, Wealth-Lab, TradeStation, RealTest plus my own coding.

Quite simply: Your system is not accessible at all to any readers. At all.

Universe Rules: Unable to define from your posts (top 10 - what? from when?)
Entry Rules: Unable to define from your posts ('n' period what?)
Exit Rules: Unable to define from your posts
Capital allocation: Somewhat defineable

You're the one talking about an "accessible trading sytem" - now show your rules.
 
My goal is to have an open and transparent exchange, but I also want to ensure I'm releasing information responsibly.

Start sharing calculations that you use.

What do you mean by responsibly? Is that when it works? Is that confirmation bias?

Prove to us that your approach is not just recency bias.
 
Top