Australian (ASX) Stock Market Forum

Dump it Here

As you know I only deal in Exact Facts....
Following your journey is great, but it's also like reading "War & Peace", and frankly I often don't have the time to try and "line up" your coloured dots to my candlesticks...

@DaveTrade, further clarifications are in order.

@DrBourse, remarked that my previous post was "like reading 'War & Peace'" and that he "frankly often doesn't have the time to try and 'line up' my coloured dots."

It's a challenge for me to strike the right balance between providing thorough explanations and keeping responses concise.

Skate.
 
@DaveTrade, my expanded reply also covered the remarks he made that my posts "was like reading "War & Peace", and frankly I often don't have the time to try and "line up" your coloured dots".

Skate.
Sorry bout that "War & Peace" comment M8, sounds a bit disrespectful, but it was posted with the utmost respect for you skate...
 
@DaveTrade, I appreciate you pointing that out. You're right that @DrBourse was simply asking for chart dates, but his post provided me with an opportunity to emphasise a few important points that I hope will benefit others.

Skate.
I would also like to see the opening price the next day
I also only deal in facts and not smoke and mirrors
 
Nah, all good. That sums up my posts quite accurately.

Skate.
And War and Peace not exactly trash writing either, so can even be seen as a compliment..
Maybe...
but i digress.
Mr Skate posts can be a bit long but i always find them insightful and trigerring new thought processes.
A great bunch of participants here
 
That's what I call Smoke and Mirrors!

@Captain_Chaza, I want to make sure I fully understand your perspective here. When you used the phrase "smoke and mirrors," are you suggesting that the information I'm providing is deceptive or misleading in some way? Or are you saying that I'm obscuring the truth or reality of the situation?

I want to address any misconceptions you may have, so could you please elaborate on what specifically you feel is being obscured or misrepresented? I'm happy to provide additional details or clarification on the information I've posted. My goal is to be as transparent and factual as possible, so I want to make sure there's no ambiguity.

I'll do my best to address your concerns constructively, as it will help me improve the way I communicate and present information in the future.

Skate.
 
@Skate I would agree with this comment and believe this is one of the goals of your thread.

@DaveTrade thank you for posting those remarks. The primary reason I post is to help others. When I'm sharing my knowledge and experiences, I know that I'm only repeating what I already know. But when others contribute to the discussion, that's where the real learning happens for me.

This thread is a small community, where we all come together to share knowledge. While some members may be more deeply invested and actively engaged than others, we all create content based on our individual experiences, with the hope that others will find value in the perspectives we share.

I believe that "sharing is caring," and my posts aim to reflect my genuine willingness to help. Supporting others is truly the heart and soul of the "Dump it here" thread.

Skate.
 
Mr Skate posts can be a bit long but i always find them insightful and trigerring new thought processes.
A great bunch of participants here

@qldfrog, I'm first to admit my posts can be a bit long, but I try to explain complexity as simply as I can. I always respect others and their way of thinking with an open mind, that's how I learn.

In this game, there are multiple valid paths to success. Maintaining an open mindset and being receptive to alternative approaches is key for advancing trading ideas.

The most valuable lessons often come from exploring alternative viewpoints and learning from each other's unique experiences. By embracing the diversity of thought within our community, we create an environment conducive to shared learning and mutual advancement.

I'm grateful for the opportunity to engage with traders who are willing to challenge my own assumptions and push me to expand my horizons. It's a great bunch of participants here.

Skate.
 
I would also like to see the opening price the next day

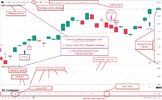
@Captain_Chaza, I've generated a TradingView chart that displays the daily price chart for NAB. This should help address your request to see the opening price for the next day.

I've also highlighted the daily price bars, and I'm happy to walk through any other details you'd like me to add to the chart to further clarify the information.

Regarding your previous "smoke and mirrors" comment, I'm still waiting for an explanation from you on why you felt the need to make that remark. As I mentioned, comments like that are never appreciated without a clear rationale. I'm open to discussing any concerns you may have, but I'd appreciate if you could provide some context around that statement first.

My goal is to have a constructive conversation respectfully. Please let me know if you have any other questions or feedback.

Reading the TradingView chart.jpg

Skate.
 
[USER=57364]@Skate[/USER] , @peter2 , @tech/a , @Sean K , and all gurus on chart and tech analysis on this forum
I may be nailing my own feet by saying that the collective strength of your knowledge should inspire @Joe Blow to start a paid wing of ASF without discontinue of this learning environment.
What a philanthropic service you folks are doing for all of us.
My commendations and gratitude

======additional===
Hello folks
I should have added the names of @So_Cynical, @DrBourse @divs4ever @Garpal Gumnut @greggles @Dona Ferentes, and others who have been keeping the sharing mantra alive with their technical analysis over the years. Thanks to you all. My senior moments allow me to recollect only a tiny amount of kB of memory. I'm so sorry for missing many active names on this forum.
 
1. AI v Human Logo.jpg

Explanation
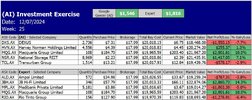
This is a theoretical investment exercise comparing the stock selections of expert fund manager Dr. Don Hamson and Google (AI) Gemini. Both provided their top 5 growth and income stocks for the ASX over the next 12 months.

Results
1st Place $1,816: Dr. Don Hamson (Expert) - BLUE line on the equity chart (2 winning positions)
2nd Place $1,546: Google Gemini (AI) - RED line on the equity chart (3 winning positions)

2. SummaryResult.jpg


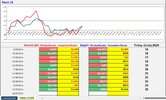
3. WeeklyUpdate.jpg

Skate.
 
View attachment 180660

Explanation
This is a theoretical investment exercise comparing the stock selections of expert fund manager Dr. Don Hamson and Google (AI) Gemini. Both provided their top 5 growth and income stocks for the ASX over the next 12 months.

Results
1st Place $1,816: Dr. Don Hamson (Expert) - BLUE line on the equity chart (2 winning positions)
2nd Place $1,546: Google Gemini (AI) - RED line on the equity chart (3 winning positions)

View attachment 180661


View attachment 180662

Skate.
an interesting progress result , considering the market closed on a new record high this week ( including a new intraday record as well )

even more insightful if you cancel out MQG ( which both selected )
 
View attachment 180660

Explanation
This is a theoretical investment exercise comparing the stock selections of expert fund manager Dr. Don Hamson and Google (AI) Gemini. Both provided their top 5 growth and income stocks for the ASX over the next 12 months.

Results
1st Place $1,816: Dr. Don Hamson (Expert) - BLUE line on the equity chart (2 winning positions)
2nd Place $1,546: Google Gemini (AI) - RED line on the equity chart (3 winning positions)

View attachment 180661


View attachment 180662

Skate.
Hi skate
Thanks
I did an arithmetic calculation and found that neither AI nor the Expert provided even a 1/2 % annual return with money left for 70 days (between 3 May and 12 July). I probably made some errors here as 0.5% does not sound right.
Assuming they were paper trades, I would have better understood the comparison if you shared both the investment /trading strategy and your conclusion with the example.
.
WHO DIDTOTAL INVESTMENT ON 5 JULYAS OF 12 JULYDAYS ELAPSEDNET PAPER GAINANNUALISED RETURN
AI$ 100,036$ 101,584
3-May-24​
12-Jul-24​
70​
1548​
0.30%​
EXPERT$ 99,991$ 101,807
3-May-24​
12-Jul-24​
70​
1816​
0.35%​
 
Last edited:
1. ASX20 LOGO.jpg
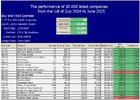
Hypothetical Investment Portfolio Analysis
The objective of this exercise is to explore a hypothetical investment scenario where $5,000 is invested in each of the top 20 companies listed in the report below, starting on the 1st of July 2024. The goal is to determine the year-to-date returns, including both capital gains and dividends, of this $100,000 investment portfolio.

3. SUNDAY POST - ASX20 Buy and Hold Strategy.jpg

Skate.
 
Top