Australian (ASX) Stock Market Forum

Dump it Here

looks like our changing color and crossing indicator business is growing! I will keep a close tap on how this thing perform during worse case market condition. Keep up the good work. and for trading view please share the link so that we know your your result and quality programming if you are a programmer skate!
 
have never read War and Peace , however sometimes even the tiniest details count ( like those white papers that accompany some ETFs )

it is up to the reader to discern important and superfluous

cheers
I am digressing !💤
We refer War and Peace to refer a long doc but what about the Harry Porter book , Da Vinci code?
They are voluminous as well.
 
looks like our changing color and crossing indicator business is growing! I will keep a close tap on how this thing perform during worse case market condition. Keep up the good work. and for trading view please share the link so that we know your your result and quality programming if you are a programmer skate!

@bettamania, I would offer a word of caution regarding the performance of the daily signal generator strategy, as it can be susceptible to market noise and may struggle during certain market conditions. For this exercise, I have applied the signal generator to a limited universe of 20 large-cap stocks. Even if the strategy generates profits in the short term, it's crucial to be cautious about its ability to withstand the test of time.

The positive aspect of the "Signal Generator" approach is that it provides a proactive, rather than reactive, approach to trading. This design aims to offer a balance between timely trade identification and risk mitigation.

Maintaining a cautious yet optimistic outlook is important when evaluating the long-term viability of this trading method to determine if this "Signal Generator" approach can consistently deliver robust performance across various market environments.

If the signal generator proves its worth trading under all conditions, I will happily share the TradingView pine script.

Skate.
Thank you for your word offer, Skate. This thing reminds me of a few past mechanical systems that I saw from a few different markets. I might be wrong but only time can tell.

Take care
 
#1. Signal Generator.jpg
@bettamania, the "signal generator" trading system is easy to understand and follow. The "Signal Generator" produces 4 coloured dots, but only two need actioning. The "Lime Dot" indicates to buy the position tomorrow, and the "Fuchsia Dot" indicates to sell the position tomorrow.

I ask:
"What could be easier?"

6. Buy Tomorrow.jpg

#1. NAB (NAB is being passed over as the 10-position portfolio is full)

NAB.jpg

Skate
 
View attachment 180707
@bettamania, the "signal generator" trading system is easy to understand and follow. The "Signal Generator" produces 4 coloured dots, but only two need actioning. The "Lime Dot" indicates to buy the position tomorrow, and the "Fuchsia Dot" indicates to sell the position tomorrow.

I ask:
"What could be easier?"

View attachment 180710

#1. NAB (NAB is being passed over as the 10-position portfolio is full)

View attachment 180711

Skate
Again thank you for your signal offer, I am quite please with my own toy
 
Trend Trading Logo.jpg
A trading method that involves analysing the direction of a security’s price movement is the backbone of technical analysis. Also, trends have different time horizons and could be embedded within one another, much like fractals. For instance, an overall uptrend on the weekly timeframe could include a downtrend on the daily.

However, many traders get caught up in the hype of complex trading strategies and the latest market fads. They were constantly chasing the next big thing, often leading to stress and inconsistent results. A different approach is to keep trading simple and focused on trend analysis.

In the end, it serves as a reminder that sometimes, simplicity is the key to success in trading. By focusing on the core principles of trend analysis and avoiding the distractions of market hype, traders can achieve better results and a more enjoyable trading experience.

Skate.
 
Trend Trading Logo.jpg
NAB - Today
The signal-based trading process is straightforward - identify the buy signal on Friday, then execute the trade the following trading day. Repeating this simple buy-and-sell sequence is about as easy as trading can get.

NAB.jpg

Skate.
 
Hi @Skate

M8 here is something for you to ponder…..
I notice that you employ “Smoothing” in a lot of your Signal Based Trading Processes…..

Smoothing is one of the biggest “No No’s” in the World of TA….

Maybe eliminating the Smoothing aspect from your efforts would produce more accurate results….

Let me explain, personally I have never used Smoothing of any sort on any Chart or Chart Indicator….
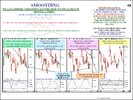
A study of Page Nr 48 from my Manual (you have a copy), explains how smoothing works…..
Page 048 Smoothing.JPG

Basically, I feel that by using Smoothing, you are ironing out all the ‘precise and exact signals’ that any TA Indicator might produce for you….
Rather than using Smoothing, I respectively suggest experimenting with shorter or longer settings on an indicator….

DrB.
 
Hi @Skate

M8 here is something for you to ponder…..
I notice that you employ “Smoothing” in a lot of your Signal Based Trading Processes…..

Smoothing is one of the biggest “No No’s” in the World of TA….

Maybe eliminating the Smoothing aspect from your efforts would produce more accurate results….

Let me explain, personally I have never used Smoothing of any sort on any Chart or Chart Indicator….
A study of Page Nr 48 from my Manual (you have a copy), explains how smoothing works…..
View attachment 180758

Basically, I feel that by using Smoothing, you are ironing out all the ‘precise and exact signals’ that any TA Indicator might produce for you….
Rather than using Smoothing, I respectively suggest experimenting with shorter or longer settings on an indicator….

DrB.

@DrBourse, thanks for sharing your thoughts on the use of smoothing in my signal-based trading processes. I appreciate you taking the time to provide this feedback and insight.

You raise an interesting point about smoothing being considered a "no-no" in technical analysis. I can certainly understand the concern that smoothing could potentially iron out or obscure some of the more precise signals that an indicator might generate.

At the same time, in my experience, a "moderate amount" of smoothing can sometimes help to filter out market noise and provide a cleaner, more reliable signal. However, your suggestion to experiment with shorter or longer indicator settings is a good one. I'll definitely take that on board and see how adjusting the parameters, without relying on smoothing, might impact the performance and reliability of the signals.

Skate.
 
Basically, I feel that by using Smoothing, you are ironing out all the ‘precise and exact signals’ that any TA Indicator might produce for you….
Rather than using Smoothing, I respectively suggest experimenting with shorter or longer settings on an indicator….
At the same time, in my experience, a "moderate amount" of smoothing can sometimes help to filter out market noise and provide a cleaner, more reliable signal.
From my experience I would agree with both of you but @DrBourse is more correct. A moderate amount of smoothing can be useful as @Skate has indicated but only when the place to use it is carefully selected and entry/exits is not one of those places. I am sounding self assured with my opinion, it comes from years of work in my trading lab.
 
@DaveTrade and @Skate ....
Like DaveTrade, I feel that Smoothing has limited use.....
"The Noise & the Whippy Signals" that are sometimes generated, especially by the use of Short Terms on Indicators, are what we need to help us make informed decisions....
Personally, i feel that Smoothing might have a use on ridiculosly LONG Term Indicators, say 60, 90, 120 or longer, and even then, only if someone is looking for a 2 year, or longer, guide from an Indicator, which in my opinion, would be a pretty useless exercise.....
Indicators are best utalised for ST Guidance, the longer the Term, the more unreliable they become (for numerous economic reasons)....
OK, enough of the lecturing - Skate, good hunting with the "No Smoothing Research" - I've always said that 'you will eventually get your desired result' - and I know that the Beginners of this world will make good use of all your hard work....
Hang in there M8....
As mentioned previously, a long time ago I spent years researching for similar 'signal-based trading processes', eventually I gave up and settled on my "DrB 3 Inds" (CCI, DMI & MFI)....
 
There's too many signals and this is due to the weakness of the MACD.
On another thread of this forum a member is paper trading a single momentum indicator and taking the signals directly from that indicator ignoring the ‘price-action’ and trend of the market. I told him I was sceptical. The price-action is the most important thing to pay attention too. If you use an indicator to determine trend then this is the most important indicator that you have.
M8 here is something for you to ponder…..
Maybe eliminating the Smoothing aspect from your efforts would produce more accurate results….

Update.jpg
Caution - lengthy detailed post

The Signal Generator
The strategy using a signal generator was a simple and accessible introduction to technical analysis for those new to trading. Early on, many beginners believe that knowing what to buy would solve all their problems, without realising that this approach is akin to putting their hand in the fire, which can only lead to getting burned. The Signal Generator was a method that aimed to provide answers using technical analysis, without the interference of human emotions.

Suggestions
The exercise was a way to observe the Signal Generator in action and follow its progress. Taking the suggestions of @peter2, @DaveTrade and @DrBourse on board, I enhanced the strategy by removing the excess signals, and adding price and trend indicators to the signal generator, while also reducing the smoothing.

The purpose of the exercise
The Enhanced Signal Generator addresses those concerns by incorporating all the suggested improvements. The key question now is whether the overall performance of the strategy will be improved. After explaining all these modifications, it's natural to wonder if we are straying away from the initial purpose of the exercise.

Metrics and results
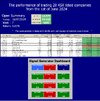
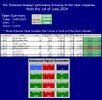
For a direct comparison, here are the trading results from both the original and the Enhanced Signal Generator strategies since June 1st, 2024:

#1. Signal Generator.jpg
Strategy 1 - Results

3. Phils Open Summary.jpg


Strategy 2 - Results

Enhanced Signal Generator Green tick of approval.jpg

ENHANCED Strategy.jpg

Initial Summary between Strategy 1 and Strategy 2
Strategy 1 - Weekly Return: 0.65%
Strategy 2 - Weekly Return: 1.09%

# Strategy 1 - Metrics:
1. Signal Generator Performance: Focuses on identifying early warning signs of potential upward moves.
2. Market Conditions: Evaluate current market trends.
3. Risk Management: Assesses risk factors.
3. Portfolio Diversification: Measures diversification across different assets.

# Strategy 2 - Metrics:
1. Enhanced Signal Generator: Includes a trend and price action indicator, potentially offering more sophisticated analysis.
2. Market Conditions: The same as Strategy 1.
3. Risk Management: The same as Strategy 1.
4. Portfolio Diversification: The same as Strategy 1.

Comparison and Conclusion
1. Higher Return: Strategy 2 has a higher weekly return (1.09% vs. 0.65%).
2. Enhanced Tools: Strategy 2 includes an enhanced signal generator with additional indicators, which may contribute to its better performance.
3. Overall, Strategy 2 appears to be more effective due to its higher return and advanced signal generation tools.

Skate.
 
View attachment 180857
Caution - lengthy detailed post

The Signal Generator
The strategy using a signal generator was a simple and accessible introduction to technical analysis for those new to trading. Early on, many beginners believe that knowing what to buy would solve all their problems, without realising that this approach is akin to putting their hand in the fire, which can only lead to getting burned. The Signal Generator was a method that aimed to provide answers using technical analysis, without the interference of human emotions.

Suggestions
The exercise was a way to observe the Signal Generator in action and follow its progress. Taking the suggestions of @peter2, @DaveTrade and @DrBourse on board, I enhanced the strategy by removing the excess signals, and adding price and trend indicators to the signal generator, while also reducing the smoothing.

The purpose of the exercise
The Enhanced Signal Generator addresses those concerns by incorporating all the suggested improvements. The key question now is whether the overall performance of the strategy will be improved. After explaining all these modifications, it's natural to wonder if we are straying away from the initial purpose of the exercise.

Metrics and results
For a direct comparison, here are the trading results from both the original and the Enhanced Signal Generator strategies since June 1st, 2024:

View attachment 180853
Strategy 1 - Results

View attachment 180852


Strategy 2 - Results

View attachment 180854

View attachment 180855

Initial Summary between Strategy 1 and Strategy 2
Strategy 1 - Weekly Return: 0.65%
Strategy 2 - Weekly Return: 1.09%

# Strategy 1 - Metrics:
1. Signal Generator Performance: Focuses on identifying early warning signs of potential upward moves.
2. Market Conditions: Evaluate current market trends.
3. Risk Management: Assesses risk factors.
3. Portfolio Diversification: Measures diversification across different assets.

# Strategy 2 - Metrics:
1. Enhanced Signal Generator: Includes a trend and price action indicator, potentially offering more sophisticated analysis.
2. Market Conditions: The same as Strategy 1.
3. Risk Management: The same as Strategy 1.
4. Portfolio Diversification: The same as Strategy 1.

Comparison and Conclusion
1. Higher Return: Strategy 2 has a higher weekly return (1.09% vs. 0.65%).
2. Enhanced Tools: Strategy 2 includes an enhanced signal generator with additional indicators, which may contribute to its better performance.
3. Overall, Strategy 2 appears to be more effective due to its higher return and advanced signal generation tools.

Skate.
Other than the content as usual being comprehensive, stood out with BUYER BEWARE (Caution - Lengthy) warning :)
 
aah yes , QBE

that one has wrong-footed me a few times , so i won't laugh so loudly

and caused me to resort to the crude channel-trade strategy that brought mid-term success ( but no longer until it goes back into the bl**dy channel )

not a bad result ( with QBE excluded )
 
Please excuse me Skates for asking But
What date are you using?
Please Note: The ALL finished the day - 3.26 % today (ie: -$ 1.75)

1721117462371.png
 
RIO finished the day -2.36% today (ie -$3.03)

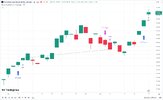
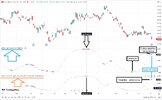
@Captain_Chaza, the chart below displays two trading strategies and a price chart for (ASX:RIO).

1. ** Original Signal Generator **
This strategy has triggered a "Sell" signal based on the current price action. The chart indicates that the stock price has reached a level where the "Original Signal Generator" is suggesting an exit or sell position tomorrow at the open.

2. ** Enhanced Signal Generator **
This second strategy also has generated a "Sell" signal based on the stock's recent price movement. The chart shows the "Enhanced Signal Generator" has identified a "Sell" for tomorrow morning.

Sell Tomorrow
Given the "Sell" signals from both the "Original Signal Generator" and the "Enhanced Signal Generator" strategies, the recommendation would be to sell RIO at the open tomorrow. Both technical indicators in the chart suggest it may be an opportune time to exit the current position.

Two Strategies.jpg

Skate.
 
Top