Australian (ASX) Stock Market Forum

Dump it Here

Hi Skate
If I can ask - when you mentioned passed over because in shopping wallet money was not there and there was no opportunity to sell some from your current kitty and replace them with purchase of any one or two of the three buys ?

Regards

@Miner, the "Signal Generator" is a theoretical 10-position, $100,000 trading strategy that buys the 10 lowest-priced companies from a watchlist of the 20 largest ASX-listed firms, with no further positions added (passed over) until an existing holding is sold.

Once the strategy is fully allocated across the 10 initial positions, there is no further capacity to add new companies to the portfolio until an existing holding is sold, at which point any subsequently generated buy signals are passed over and not executed. This creates a static, fixed-size portfolio that can only be adjusted by closing out one position to open a new one.

By restricting the strategy to the 10 lowest-priced companies from the 20-stock watchlist, it aims to capture potential upside from a maximum of 10 companies. The strict 10-position limit and inability to add new holdings while fully invested are designed to impose investment discipline and prevent over-diversification.

Skate.
 
Last edited:
#1. Signal Generator Logo.jpg
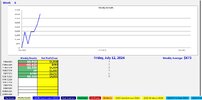
@Miner, the capture below demonstrates that the 10-position portfolio is currently full. Since this is a fixed-size strategy, there is no available capacity to add new positions until an existing holding is closed out. Any new buy signals generated for companies not already in the portfolio will be passed over and not executed, as the strategy parameters restrict it to maintaining precisely 10 positions at all times. This static portfolio structure is a key feature of the investment approach.

3a. Phils Open Summary.jpg

Skate.
 
#1. Signal Generator Logo.jpg

The Signal Generator - Trading Rules
The signal generator is designed to produce buy and sell signals based on a watchlist of 20 ASX-listed companies. When there are more buy signals generated than available portfolio positions, the strategy is to execute the first 10 signals and add any additional signals when existing positions are subsequently sold.

When confronted with excess buy signals beyond the 10-position capacity, the strategy selects the lowest-priced stocks first to fill the open slots. The core principle is to maintain a static 10-stock portfolio structure, only adjusting it by closing out one position to open a new one.

The key trading rules are:
1. Buy the first 10 signals.
2. Only buy signals when necessary to fill a 10-position portfolio.
3. Prioritise buying the lowest-priced stocks.
4. Execute buy and sell orders in the pre-auction the very next trading day, as this is a daily trading system.
5. Determine position size by dividing the closing share price by the dollar value of your next bet.
6. Add 5% to the last closing price to formulate your buy offer. (in the preauction)

By following these straightforward rules, you can establish a solid, disciplined foundation for your trading activities. The simplicity of the static 10-position portfolio construction allows you to focus on consistently executing the generated buy and sell signals, rather than getting bogged down in complex, discretionary decision-making.

Skate.
 
@Miner, to maintain simplicity and avoid any potential confusion going forward, I will refrain from displaying any buy/sell signals that cannot be executed due to the portfolio being at its 10-position capacity. The strategy is designed to only act on the first 10 signals generated, passing over any additional signals until an existing position is closed. By not showing unactionable signals, we can keep the focus on the core trading rules and execution of the strategy.

Skate.
 
View attachment 180470

The Signal Generator - Trading Rules
The signal generator is designed to produce buy and sell signals based on a watchlist of 20 ASX-listed companies. When there are more buy signals generated than available portfolio positions, the strategy is to execute the first 10 signals and add any additional signals when existing positions are subsequently sold.

When confronted with excess buy signals beyond the 10-position capacity, the strategy selects the lowest-priced stocks first to fill the open slots. The core principle is to maintain a static 10-stock portfolio structure, only adjusting it by closing out one position to open a new one.

The key trading rules are:
1. Buy the first 10 signals.
2. Only buy signals when necessary to fill a 10-position portfolio.
3. Prioritise buying the lowest-priced stocks.
4. Execute buy and sell orders in the pre-auction the very next trading day, as this is a daily trading system.
5. Determine position size by dividing the closing share price by the dollar value of your next bet.
6. Add 5% to the last closing price to formulate your buy offer. (in the preauction)

By following these straightforward rules, you can establish a solid, disciplined foundation for your trading activities. The simplicity of the static 10-position portfolio construction allows you to focus on consistently executing the generated buy and sell signals, rather than getting bogged down in complex, discretionary decision-making.

Skate.
Excellent coach @Skate 👏
 
First year loss happened you have made the profit I hope?
I have made about USD90,000 on a crypto scam seeing my profit was US$590K.
My fat fingers on small phone key board.
I made USD 90 k super fund loss on that scam when it was showing USD 590K profit.
The greed and idiosyncratic blindness, costed me heavily.
Complained to FINRA, who handballs to FBI without getting acknowledgement from FBI since a year now.
 
Trading a breakout strategy
I hope @peter2 reads this post, as it directly compares the performance of the strategy presented here to the 'Signal Generator Strategy'. The metrics and results provided below are from a Metastock code that was shared with me when I was eager to learn about system coding. I have since implemented this Metastock code in TradingView Pine Script, and the corresponding results are indicated below.

Generosity is Kindness
During my research days back in 2014, I had the opportunity to speak with an author and podcast presenter. Through our discussions, we developed a friendship, and he eventually shared with me the "Metastock code" that he uses for his fund trading. He explained that his trading methodology was relatively straightforward.

The author asked me to refrain from mentioning his name or firm when sharing the Metastock formula with others. The formula itself is relatively straightforward for those familiar with Metastock coding.

This is a copy of one of his emails to me (one of many)
Here you go...Remember that indicators and systems are just the beginning of building your trading plan. It is all about risk management and trading psychology. If I can assist you please let me know. Thank you.

Generosity of Connections
Following his podcast, the author mentioned that I was the only person who had approached him for further information. As our friendship grew, he generously offered to send me his three books free of charge. Not long after, I transitioned to using AmiBroker. I have now converted his code into a TradingView Pine Script. The results are below if anyone is interested.

1. Open Summary.jpg


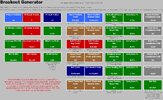
2. Breakout Generator Dashboard.jpg


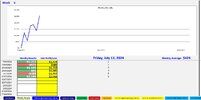
3. Weekly Results.jpg


4. Buy Trades.jpg


5. Sold Trades.jpg

Skate.
 
#1. Signal Generator Logo.jpg
The Signal Generator Trading System
This hypothetical trading exercise is designed to trade 10 large ASX companies, selected from a watchlist of 20 companies. Buy and sell signals are generated daily, effective from the 1st of June 2024.

Portfolio Allocation
The (Signal Generator Portfolio) will be diversified across 10 holdings, with each position allocated $10,000, capping the total portfolio value at $100,000. This ongoing exercise aims to provide a clear assessment of the relative performance of this trading idea.

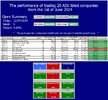
3. Phils Open Summary.jpg


2. Weekly Results.jpg

Skate.
 
Trading a breakout strategy
I hope @peter2 reads this post,
Of course I'll read your trading posts. I plotted each trade on my charts was impressed by the performance of the Metastock system considering it's trading the largest cap stocks on the ASX.

Minor queries regarding two positions.
REA - the large down bar on 1/7/24 might have triggered an exit similar to the QBE exit.
STO - there was no break-out to trigger this entry (?) and the following down days might have triggered an exit in a similar manner to the ANZ exit.

I've no doubt the system data is correct but there are some inconsistencies that I've noted.

My research into trading these large caps is very promising and I'll be starting a Liquid Large Cap portfolio myself soon. This won't be posted.

@peter2, thank you for your analysis of the 21-period Breakout trading strategy. I appreciate you taking the time to examine the performance and provide your insights.

While the concept of the 21-period Breakout Strategy is relatively straightforward. I'm not a fan of trading daily strategies, as they can be susceptible to market noise and may not perform as well on a limited universe of large-cap stocks, such as the ASX blue chips.

In my experience, trading systems like the "Signal Generator" and this "21-day Breakout" approach often struggle to deliver consistent, long-term profitability. Even if the strategy manages to generate profits in the short-term, I would be cautious about its ability to withstand the test of time.

That said, I do believe that the exercise of analysing and testing these types of strategies can be valuable, as it can provide insights into the challenges of developing effective trading systems. I'm glad to hear that your research into trading large-cap stocks has been promising. I wish you the best of luck.

The workings of the 21-day breakout strategy
1. This strategy enters a long position when the current value of the selected price type is greater than the previous 21-day high, signalling a potential start of a bullish trend.

2. To exit the long position, the strategy uses a 10-day parameter to calculate the lowest value (LLV) of the selected price type. It exits the long position when the current value is less than the previous 10-day low, indicating a potential bearish reversal.

The concept
The longer 21-day entry period helps filter out short-term noise and identify more significant breakouts, while the shorter 10-day exit period allows the strategy to respond more quickly to bearish reversals. This approach aims to capture the potential upside of a breakout while being responsive to trend changes.

TradingView Charts
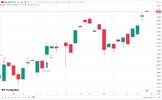
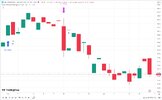
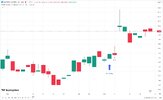
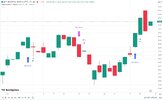
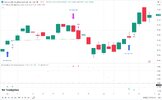
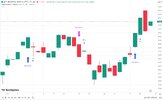
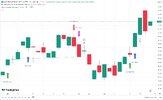
The charts for REA, QBE, STO, and ANZ are presented in the order you listed them in your post.

#1. REA

5. REA.jpg


#2. QBE

6. QBE.jpg


#3. STO

7. STO.jpg


#4. ANZ

8. ANZ.jpg

Skate.
 
Is there any reason why you have eliminated the Signaling Chart?
Is there a way you can place a Vertical line to verify the Signal?
 
Is there any reason why you have eliminated the Signaling Chart?
Is there a way you can place a Vertical line to verify the Signal?

@Captain_Chaza, let me clarify the information you requested:

The price chart displayed above showcases a new breakout strategy. It clearly indicates the signal bar, followed by the large arrow and the subsequent buy bar (on the next trading day).

The "Signal Generator" you mentioned, however, is a completely separate strategy that utilizes a different price chart and indicator setup.

I hope this helps explain the distinction between the two strategies and the corresponding chart elements. Please let me know if you have any other questions!

#1. This is the ANZ Chart for the "Signal Generator Strategy"

8a. ANZ - Signal generator.jpg


#2. This is the ANZ Chart for the "Breakout Strategy"

8. ANZ.jpg


If I was to put the two strategies on the one chart

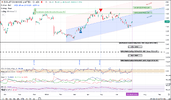
@Captain_Chaza, the chart below is from combining the charts from the two different strategies. If you were to put the charts together, the signals could be confusing, to say the least.

In all honesty, while the signals from the two strategies may appear close, it's important to recognise that they are derived from distinct methodologies. Mixing the signals from these separate strategies could lead to a lack of clarity and potentially introduce conflicting information.


9. ANZ - Breakout generator.jpg

Important info
1. The "Red and Green" arrows belong to the "Signal Generator Strategy"
2. The "Blue and Fuchsia" arrows belong to the "Breakout Strategy"

Skate.
 
Challenge 3.jpg
Are you up for a challenge?
I challenge anyone to showcase an easier trading system that beginners can understand and follow. In that spirit, let me present "Skate's Signal Generator" as a potential candidate.

Proactive, not Reactive
"Skate's Signal Generator" can serve as an excellent starting point for those new to trading. The rationale behind the four-dot approach is to provide both anticipatory and confirmatory signals, which can help traders prepare their positions more effectively. Here's a breakdown of how the signal generator could work:

1. Lime Dot (Buy Signal)
The lime dot acts as a leading indicator, giving traders a heads-up to buy the position in the pre-market to secure the opening price.

2. Green Dot (Buy Dot)
This is the buy bar, confirming that traders should have already executed their buy positions on this bar.

3. Fuchsia Dot (Exit Signal)
The fuchsia dot gives traders a heads-up when to exit a position in the pre-market to ensure settlement at the opening price.

4. Red Dot (Sell Dot)
This is the sell bar, confirming that traders should have already exited their positions on this bar.

Just follow the coloured dots
A chart that displays only coloured dots helps eliminate any potential for confusion. This level of visual clarity and advance notice can be a game-changer for those new to trading. It allows them to enter the market with confidence, timing their trades to potentially capture favourable opening prices.

If you trust the signals
You will diligently follow the system.

"Skate's Signal Generator" - Example using the (NAB) Stock Chart
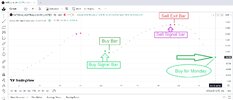
The chart below displays a "Lime Dot" at the end of the signal line. The buy signal called the "Signal Bar" was generated at the close of trading yesterday. This lime dot acts as a leading indicator, giving traders advance warning of an upcoming buy signal for Monday. Traders should be prepared to execute their buy order in the pre-market session to potentially capture the opening price when the market opens next.

NAB - National Australia Bank
The chart below displays a "Lime Dot" (Signal Bar) at the end of the signal line, providing traders with advance notice to prepare a buy order for NAB in the pre-market session on Monday.

NAB Challenge.jpg

Skate.
 
Last edited:
Is there any reason why you have eliminated the Signaling Chart?
Is there a way you can place a Vertical line to verify the Signal?

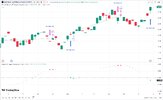
@Captain_Chaza, this is the "Skate's Signal Generator" system that is reflected on the price chart below. The green connecting line joins the buy signal bar to the exit signal bar, providing a visual reflection of the trade's performance.

NAB Signal Generator and Chart.jpg

Skate.
 
Is there any reason why you have eliminated the Signaling Chart?
Is there a way you can place a Vertical line to verify the Signal? - Yes they have been added to the chart
My research into trading these large caps is very promising and I'll be starting a Liquid Large Cap portfolio myself soon.

When questions are raised, it means I haven't clearly explained the point I was trying to make. I shared another trading strategy that was developed with the kindness of someone 10 years ago. After working with platforms like Metastock, Amibroker, and now TradingView, I've learned that the transition to understanding the unique features of each platform takes time.

Since I've let my Norgate Data subscription lapse, I'm now at the stage where a beginner could start trading without any financial outlay. The charts posted in TradingView are an example of how someone can get started in the exciting world of trading.

My New Project
After @peter2 mentioned that I could do better, I was inspired to code a "Breakout Strategy" that was given to me years ago in Metastock format. Converting it into TradingView's Pine Script was relatively easy, as there are only a few moving parts. It's not a simple strategy, but it's not fully complex either.

The key was to retain the format between the "Signal Generator" and the "Breakout Strategy" so that others could understand the logic behind both and see the similarities in the charts, even though they are derived from different methodologies.

Chart explanation of the "Breakout Strategy"
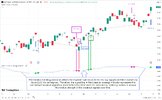
To address @Captain_Chaza's request, here's an example of the vertical line added to the chart to verify the signals in the "Breakout Strategy" strategy.

The Breakout Strategy Chart Explanation.jpg

Skate.
 
When questions are raised, it means I haven't clearly explained the point I was trying to make. I shared another trading strategy that was developed with the kindness of someone 10 years ago. After working with platforms like Metastock, Amibroker, and now TradingView, I've learned that the transition to understanding the unique features of each platform takes time.

Since I've let my Norgate Data subscription lapse, I'm now at the stage where a beginner could start trading without any financial outlay. The charts posted in TradingView are an example of how someone can get started in the exciting world of trading.

My New Project
After @peter2 mentioned that I could do better, I was inspired to code a "Breakout Strategy" that was given to me years ago in Metastock format. Converting it into TradingView's Pine Script was relatively easy, as there are only a few moving parts. It's not a simple strategy, but it's not fully complex either.

The key was to retain the format between the "Signal Generator" and the "Breakout Strategy" so that others could understand the logic behind both and see the similarities in the charts, even though they are derived from different methodologies.

Chart explanation of the "Breakout Strategy"
To address @Captain_Chaza's request, here's an example of the vertical line added to the chart to verify the signals in the "Breakout Strategy" strategy.

View attachment 180614

Skate.
@Skate , @peter2 , @tech/a , @Sean K , and all gurus on chart and tech analysis on this forum
I may be nailing my own feet by saying that the collective strength of your knowledge should inspire @Joe Blow to start a paid wing of ASF without discontinue of this learning environment.
What a philanthropic service you folks are doing for all of us.
My commendations and gratitude 🙏
 
When questions are raised, it means I haven't clearly explained the point I was trying to make. I shared another trading strategy that was developed with the kindness of someone 10 years ago. After working with platforms like Metastock, Amibroker, and now TradingView, I've learned that the transition to understanding the unique features of each platform takes time.

Since I've let my Norgate Data subscription lapse, I'm now at the stage where a beginner could start trading without any financial outlay. The charts posted in TradingView are an example of how someone can get started in the exciting world of trading.

My New Project
After @peter2 mentioned that I could do better, I was inspired to code a "Breakout Strategy" that was given to me years ago in Metastock format. Converting it into TradingView's Pine Script was relatively easy, as there are only a few moving parts. It's not a simple strategy, but it's not fully complex either.

The key was to retain the format between the "Signal Generator" and the "Breakout Strategy" so that others could understand the logic behind both and see the similarities in the charts, even though they are derived from different methodologies.

Chart explanation of the "Breakout Strategy"
To address @Captain_Chaza's request, here's an example of the vertical line added to the chart to verify the signals in the "Breakout Strategy" strategy.

View attachment 180614

Skate.
Hi @Skate....
So far so good - However can I ask, as different platforms project slightly different candlesticks, to avoid confusion, to save our time, and to make sure we are all on the same page - that you show a date for each Signal Line, similar to that available in TradingView....
eg as shown below....
EVN Cht 20240707.png
In my above EVN Chart it is easy to identify the Containment Candle Formation on 4/12/23, and my Buy on 14/3/24 and the subsequent Sell on 30/4/24, and the chart date of Fri 05-07-2024.....

As you know I only deal in Exact Facts....
Following your journey is great, but it's also like reading "War & Peace", and frankly I often don't have the time to try and "line up" your coloured dots to my candlesticks...

Cheers M8....
 
Last edited:
Following your journey is great, but it's also like reading "War & Peace", and frankly I often don't have the time to try and l
"line up" your coloured dots to my candlesticks...

@DrBourse, I appreciate the feedback. You make a fair point.

I may have been oversharing and posting too much, which can be exhausting to follow along. The intent behind sharing the "Breakout Strategy" was to explore more reliable entry methods, as trading breakouts have been quite successful for me over the years. However, I understand that the amount of information can be overwhelming.

Going forward, I will focus more on sharing the "Signal Generator" rather than continuing to post the full "Breakout Strategy." I will also make sure to provide a clear "Open Summary" with all the Buy and Sell positions displayed. This should make it easier to follow the key information, rather than getting lost in the details.

I understand the challenge of revisiting past positions when the portfolio is already full. The date display limitations in TradingView can make it difficult to easily review earlier signals. I'll keep this in mind and try to strike a better balance between providing valuable insights and not overloading this thread with information.

Skate.
 
@Skate , @peter2 , @tech/a , @Sean K , and all gurus on chart and tech analysis on this forum
I may be nailing my own feet by saying that the collective strength of your knowledge should inspire @Joe Blow to start a paid wing of ASF without discontinue of this learning environment.
What a philanthropic service you folks are doing for all of us.
My commendations and gratitude 🙏

@Miner, your kind words and appreciation for the collective knowledge shared in this forum are truly appreciated. Let's continue fostering a collaborative environment for the benefit of all.

Skate.
 
@DrBourse, I appreciate the feedback. You make a fair point.

I may have been oversharing and posting too much, which can be exhausting to follow along. The intent behind sharing the "Breakout Strategy" was to explore more reliable entry methods, as trading breakouts have been quite successful for me over the years. However, I understand that the amount of information can be overwhelming.

Going forward, I will focus more on sharing the "Signal Generator" rather than continuing to post the full "Breakout Strategy." I will also make sure to provide a clear "Open Summary" with all the Buy and Sell positions displayed. This should make it easier to follow the key information, rather than getting lost in the details.

I understand the challenge of revisiting past positions when the portfolio is already full. The date display limitations in TradingView can make it difficult to easily review earlier signals. I'll keep this in mind and try to strike a better balance between providing valuable insights and not overloading this thread with information.

Skate.
When I read @DrBourse 's post I thought he was just asking to put dates on your charts.
 
Top