Australian (ASX) Stock Market Forum

Dump it Here

no thank you

am nicely up on WES ( nearly $30 a share ) so will probably resist selling/reducing as well

@divs4ever, everyone is driven by their own perceptions and personal biases, and we all strive to act in what we believe to be our best interests. However, the primary focus in trading should be on cultivating the discipline to follow a systematic approach without hesitation, regardless of the particular indicators or signals used.

Developing the ability to trade with a detached, unemotional mindset, where money flows freely in and out of positions, is the key to long-term success in this endeavour. With trend-following strategies, for example, it's common for half or more of the positions taken to result in losses. Knowing and accepting this probabilistic reality can actually make it easier to take the signals as they arise.

Ultimately, successful trading is a game of probabilities, not certainties. The trader who can condition themselves to execute their strategy consistently, without becoming overly attached to individual outcomes, are more likely to achieve sustainable profitability over time.

9 or 6.jpg

With trading, perception is everything
How we interpret and make sense of the market is what truly matters. The same data can be perceived in vastly different ways - a glass may be seen as half empty or half full, and both perspectives have validity.

Skate.
 
the interesting twist is

in December 2018 ( after the COL spin-off ) i opened the wallet up fairly wide and bought a handful of WES @ $31.17 ( to go with the existing holding )

who would have thought the WES share price would rise more than twice the current value of a COL share AFTER the demerger

rather counter-intuitive IMO
 
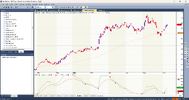
Your Mc Dv is kinda different with mine But I got early entry than yours, Skate! Again as with my case I dont tell people to buy or sell . this post is just for coding purposes and brain exercise only

1718114481943.png
 
Your Mc Dv is kinda different with mine But I got early entry than yours, Skate! Again as with my case I dont tell people to buy or sell . this post is just for coding purposes and brain exercise only

View attachment 178541

Deciphering trading information and making informed decisions
@bettamania, thank you for sharing your Amibroker chart. The transparency you've provided allows me to offer a few comments. The world of trading and investing is inundated with a vast array of information, analysis, and opinions - from technical indicators to expert predictions. With so much data and conflicting signals, it can be overwhelming for individuals to determine what is truly reliable and trustworthy when making critical buying, selling, or holding decisions.

The sheer volume of trading information available online presents a significant challenge. The prevalence of technical analysis further complicates the decision-making process. Different technical indicators can often point to contrasting buy and sell signals, leaving us uncertain about the true underlying trends.

Ultimately, the key to successful investing in the face of abundant and often conflicting information is to maintain a balanced, disciplined, and well-researched approach so you can make more informed and confident trading decisions. I have attached more information below to add to the confusion.

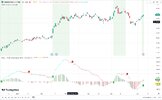
MACD Bullish area in green shading (top chart)
All technical indicators convey information in their distinctive ways. How you interpret these ultimately shapes the decisions you will make.

Bullish.jpg


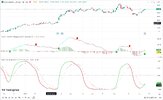
A smoothed MACD Indicator (bottom chart)
The smoothed MACD indicator tells its own distinct story through the interplay of its components. Interpreting when to act requires an understanding of how this technical indicator conveys trends and momentum. Do you buy when the smoothed MACD line crosses the signal line, or do you buy and sell the colour changes of the smoothed MACD line? Deciphering the information is a nightmare.

Smoothed MACD.jpg

Skate.
 
Concise communication is preferred over lengthy, detailed posts
I appreciate reading long posts is exhausting, let alone taking the time to thoroughly understand what is being presented. I'm more of a traditionalist, finding it challenging to convey my message effectively in just a few words.

Skate.
 
..."Deciphering the information is a nightmare."

Far as I know some of the variation signals are crossing fast and slow, or just like your style crossing particular value. Either way, there is no absolute right or wrong. Interesting to see how this McD perform.


Deciphering trading information and making informed decisions
@bettamania, thank you for sharing your Amibroker chart. The transparency you've provided allows me to offer a few comments. The world of trading and investing is inundated with a vast array of information, analysis, and opinions - from technical indicators to expert predictions. With so much data and conflicting signals, it can be overwhelming for individuals to determine what is truly reliable and trustworthy when making critical buying, selling, or holding decisions.

The sheer volume of trading information available online presents a significant challenge. The prevalence of technical analysis further complicates the decision-making process. Different technical indicators can often point to contrasting buy and sell signals, leaving us uncertain about the true underlying trends.

Ultimately, the key to successful investing in the face of abundant and often conflicting information is to maintain a balanced, disciplined, and well-researched approach so you can make more informed and confident trading decisions. I have attached more information below to add to the confusion.

MACD Bullish area in green shading (top chart)
All technical indicators convey information in their distinctive ways. How you interpret these ultimately shapes the decisions you will make.

View attachment 178564


A smoothed MACD Indicator (bottom chart)
The smoothed MACD indicator tells its own distinct story through the interplay of its components. Interpreting when to act requires an understanding of how this technical indicator conveys trends and momentum. Do you buy when the smoothed MACD line crosses the signal line, or do you buy and sell the colour changes of the smoothed MACD line? Deciphering the information is a nightmare.

View attachment 178565

Skate.
 
@divs4ever, everyone is driven by their own perceptions and personal biases, and we all strive to act in what we believe to be our best interests. However, the primary focus in trading should be on cultivating the discipline to follow a systematic approach without hesitation, regardless of the particular indicators or signals used.

Developing the ability to trade with a detached, unemotional mindset, where money flows freely in and out of positions, is the key to long-term success in this endeavour. With trend-following strategies, for example, it's common for half or more of the positions taken to result in losses. Knowing and accepting this probabilistic reality can actually make it easier to take the signals as they arise.

Ultimately, successful trading is a game of probabilities, not certainties. The trader who can condition themselves to execute their strategy consistently, without becoming overly attached to individual outcomes, are more likely to achieve sustainable profitability over time.

View attachment 178537

With trading, perception is everything
How we interpret and make sense of the market is what truly matters. The same data can be perceived in vastly different ways - a glass may be seen as half empty or half full, and both perspectives have validity.

Skate.
 
It is Great to see you playing around with Technical Analysis instead of Dividends , Franked , Half Franked and Fly-Buy carrots

@Captain_Chaza, there's been a surge of interest following my shift in posting from investing to trading, there have been numerous inquiries and suggestions about my tweaked version of Alex Spiroglou’s MACD-v indicator. In response to @bettamania post, I underscored the reality that technical indicators can emit conflicting buy and sell signals, casting doubt on the actual market trends. This led me to share a chart illustrating my adaptation of the Smoothed MACD indicator. I’ve since received some questions regarding this strategy, which I intend to address in an upcoming post.

Skate.
 
The Smoothed MACD Strategy
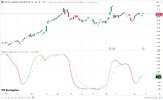
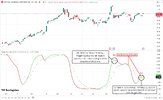
In addressing a question about the "Smoothed MACD Strategy" it was asked (a) "Do you initiate a buy when the Smoothed MACD line crosses the signal line", or (b) "Do you act based on the colour transitions of the Smoothed MACD line?’".

Traditionally, the practice has been to buy and sell when the smoothed signal line crossover with the MACD line. However, the intriguing possibility of trading based on the signal line’s colour changes cannot be dismissed.

Skate's Smoothed MACD Strategy.jpg

Skate.
 
This was the follow-up question - "Which method would be the most effective?"
In response to the query about which would be the most effective method to use, actioning when the smoothed MACD line crosses the MACD line or when the colour transitions of the Smoothed MACD line, I will include the two scenarios in my weekly analysis of the (MACD-sv) Strategy.

Weekly Update
The ongoing updates of the (MACD-sv) results will now feature two additional strategies "reported separately", being:

(a) SMACD-Cross Strategy - Initiating buy and sell signals upon the Smoothed MACD line’s crossover with the signal line.
(b) SMACD-Colours Strategy - Triggering buy and sell signals based on the colour changes of the Smoothed MACD line.

In essence
This exercise will encompass three distinct MACD strategies for analysis.

Skate's Smoothed MACD Strategy.jpg

Skate.
 
This was the follow-up question - "Which method would be the most effective?"
In response to the query about which would be the most effective method to use, actioning when the smoothed MACD line crosses the MACD line or when the colour transitions of the Smoothed MACD line, I will include the two scenarios in my weekly analysis of the (MACD-sv) Strategy.

Weekly Update
The ongoing updates of the (MACD-sv) results will now feature two additional strategies "reported separately", being:


In essence
This exercise will encompass three distinct MACD strategies for analysis.

View attachment 178611

Skate.
There is another variation i.e. crossing OB or OS or Midline
 
There is another variation i.e. crossing OB or OS or Midline

@bettamania, there exists a plethora of MACD indicator variations, each with the potential to form the basis of a trading strategy. However, it is imperative to conduct a thorough analysis before preferring one variant over another. Ultimately, the cornerstone of successful trading is to uphold a balanced and disciplined approach, underpinned by meticulous research. This enables you to make more informed and confident trading decisions.

Skate.
 
..."
This enables you to make more informed and confident trading decisions"...

Thank you very much Skate for the offers, I got more than enough systems for ASX ( equity and CFD ) with both direction (L&S) and different styles ( BO, mean reversion, semi countertrend) . and I am in a process of converting them into AFL. If I am lucky enough and got more time and funds I am looking into US market.

Seeing you are so keen for oscilators and I am pretty sure some ( or even a lot of people) are still looking; I just give you some of my ideas, nothing else! no bad intentions or anything
 
I got more than enough systems for ASX ( equity and CFD ) with both direction (L&S) and different styles ( BO, mean reversion, semi countertrend) . and I am in a process of converting them into AFL. If I am lucky enough and got more time and funds I am looking into US market.

I just give you some of my ideas, nothing else!

@bettamania, it’s great to hear that you’ve amassed a diverse array of systems catering to various trading styles and markets. Your initiative to convert these into AFL is commendable. It’s clear that your approach is methodical and well-planned.

Your willingness to share your ideas is a testament to the collaborative spirit of this thread. Sharing knowledge and ideas without ulterior motives enriches the community, and I’m sure many will appreciate your insights. Keep up the great work and keep posting.

Skate.
Why don't anyone discuss about ROAR ? rate of annual return that belongs to Allan Hull?
 
Why don't anyone discuss about ROAR ? rate of annual return that belongs to Allan Hull?

@bettamania, the Rate of Annual Return (ROAR) is an indicator by Allan Hull for identifying rapidly appreciating shares. It calculates the current rate of return by comparing the annual price increase to the current share price. If you’re interested in discussing ROAR, feel free to start a conversation here!

Skate.
 
#1a. MACD-sv Logo.jpg

The (1. MACD-sv Strategy) is an adapted MACD-v indicator
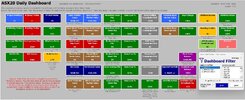
This hypothetical trading exercise is the first of three MACD trading strategies under review. This strategy is designed to trade 20 large ASX companies as of the 1st of June 2024.

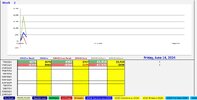
The (MACD-sv Portfolio) is diversified across 10 holdings, each allocated $10,000, capping the total of each strategy at $100,000. This ongoing exercise will provide a clear assessment of the relative merits of this trading strategy.

#1b. MACD-sv Dashboard.jpg


#1ba. Weekly Result.jpg


#1c. MACD-sv Open Summary.jpg


#1d. MACD-sv Buy Trades.jpg

Skate.
 
#2a. SMACD-Cross Logo.jpg

The (2. SMACD-Cross Strategy) is adapted from a Smoothed MACD indicator
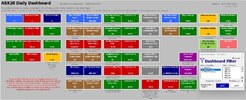
This hypothetical trading exercise is the second of three MACD trading strategies under review. This strategy is designed to trade 20 large ASX companies as of the 1st of June 2024.

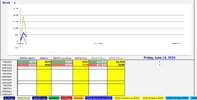
The (SMACD-Cross Portfolio) is diversified across 10 holdings, each allocated $10,000, capping the total of each strategy at $100,000. This ongoing exercise will provide a clear assessment of the relative merits of this trading strategy.

#2b. CROSS Dashboard.jpg


#2ba. Weekly Result.jpg


#2c. CROSS Open Summary.jpg


#2d. CROSS Buy Trades.jpg


#2e. CROSS Sell Trades.jpg

Skate.
 
Top