Australian (ASX) Stock Market Forum

Dump it Here

So is this 'strategy' ending on 30 June 2024?

Obviously the answer is yes.

So fairly pointless for me to continue the EWA strategy.

Rather, what I will do is demonstrate a strategy in the US that could be replicated (possibly) in Aus.

This is the same strategy that I would have implemented with EWA, but in the US it just provides so many more possibilities to structure the trade.

View attachment 178787

View attachment 178786

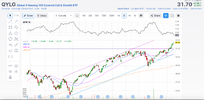
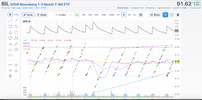
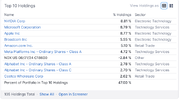
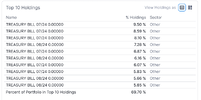
So you allocate a % of your $100K to stock, in this case QYLG which 50% hedges its position by selling covered Calls and BIL which is a short term Treasury paper.

Both provide a yield.

So in this instance I will go 20% QYLG and 80% BIL.

As I add to the QYLG position, I sell BIL to obtain the cash with which to fund that purchase. This way (obviously) you obtain a far better overall return.

I'll use Monday's closing prices as my start point.

jog on
duc
Any clarity on how , why and when you add to QYLG?
 
Any clarity on how , why and when you add to QYLG?

So the 'experiment' was for the best (most profitable) method for long term investing and avoiding the frenetic chaos of day trading and reducing the effort required in position trading (weekly systems).

There is the 'buy and hold' method, where once stocks selected, you sit back passively, collect dividends and land where you land.

My strategy is an 'inbetween' strategy. Limited trading, once a month possibly even less depending on market volatility. Collecting a good (safe) yield (ignoring nominal vs real for the moment). Using market profits to compound your initial investment.

So originally I was simply going to compare apples to apples: ie. Mr Skates Top 20 vs ASX market represented via EWA. Australian instruments are quite limited.

I wanted (to increase returns) to sell covered CALLS on the stock.

This QYLG is exactly that strategy, selling covered CALLS on 50% of its stock holdings.

BIL is short term Bills returning a yield. Far better than just sitting in cash.

So I will run both strategies.

Hypothetical $100K

QYLG = $20K
BIL = $80K

Screen Shot 2024-06-18 at 3.15.57 AM.pngScreen Shot 2024-06-18 at 3.16.35 AM.png


So:

QYLG = 630 shares = $19,971.00
BIL = 873 shares = $79,984.26

Total = $99,955.26
Cash = $44.74

This will now run alongside the EWA experiment.

So QYLG:

Screen Shot 2024-06-18 at 8.29.01 AM.pngScreen Shot 2024-06-18 at 8.29.11 AM.png

BIL

Screen Shot 2024-06-18 at 8.30.16 AM.pngScreen Shot 2024-06-18 at 8.30.26 AM.png


jog on
duc
 
Juneteenth National Independence Day (19th of June)
This Federal Holiday commemorates the end of slavery in the United States and is known as “Freedom Day” or "Emancipation Day". The Nasdaq and New York Stock Exchange will be closed on Wednesday, 19th of June and reopen on Thursday, 20th of June.

Skate.
 
@Skate , forgive me if others have posted this, or the subject has moved on, but there's an interesting analysis of the Most Consistent Dividend payers in the ASX50, for the last few years.

Quire a few ideas are tossed atound, rather than repaste, I'll post the link.

 
@Skate , forgive me if others have posted this, or the subject has moved on, but there's an interesting analysis of the Most Consistent Dividend payers in the ASX50, for the last few years.

Consistent, reliable dividends ensure a stable and secure retirement income
@Dona Ferentes, thank you for posting the hyperlink. As an investor, the consistency and reliability of a company's dividend yield, combined with 100% franking credits is extremely important, especially for self-funded retirees, as it allows for better long-term planning.

Investing is not just about the immediate financial benefit
I'm more concerned about consistent dividends to provide a stable foundation to enjoy a predictable, sustainable income stream. This is precisely what self-funded retirees aspire to when investing, rather than purely focusing on trading for short-term gains.

Skate.
 
I believe you are not alone my friend. I got another story regarding "missing opportunity as part of my excitement with new trading system. but my problem eveloves around my "inability to commit a significant amount for my trading systems" i,e a few trading systems traded for 100k only that is also the main reason why I am picking up a few side hustles so that hopefully by the time I finished converting everything into AB; I am able to fully finance 100K for each system ( this is my hope").

My biggest regret is on FND
1718773118887.png

I don't mean to pick on you for DRO but learning from FND I quickly focus on 1 system and play with others if only I am fully ready to play like "big boys"!

This is just my poor condition and I believe I can change this soon!
1718780044324.png


Thanks for the support, but we use benchmarks for a reason. That is, to assess our performance against holding cash or buying an index ETF and just holding on. I'm not being hard on myself by saying my performance shown in the Combo portfolio this FY has been poor. When we take on the responsibility of trading in a discretionary manner we must be honest when we fail to beat our benchmarks.

Sure it's been a difficult year for some. Those that bought an index ETF and just held it had a much easier year. Those that bought the US index ETF had a better than average year.

Reviewing my trading actions (not ideas or opinions) throughout the year shows that I've made too many mistakes. Mistakes cost money or worse, miss out on good opportunities. My biggest mistake of the year was not re-buying DRO after seeing that my exit had been shown to be too early.

View attachment 178754

There were other mistakes throughout the year and they all add up to something significant.

I know we all make mistakes and I'm not being overly harsh of myself. I realise that mistakes are common, especially when I chose to use a discretionary trading style. I don't grade myself against perfection but I know what's good enough.

Should I consider another style? How about buy and hold? No way, I couldn't handle the large drawdowns.

How about using systems? I've considered this and tried a few times but I've realised that it requires a lot of work before I would be happy to allow trading systems to manage my money. I've estimated that I'd need about 8 -10 systems to capture most of the nuisances of price action just to go long. I know, start with one, perfect it, then another and so on. With my personality type I could get stuck down the analytical rabbit hole and never trade at all.
 
So the 'experiment' was for the best (most profitable) method for long term investing and avoiding the frenetic chaos of day trading and reducing the effort required in position trading (weekly systems).

There is the 'buy and hold' method, where once stocks selected, you sit back passively, collect dividends and land where you land.

My strategy is an 'inbetween' strategy. Limited trading, once a month possibly even less depending on market volatility. Collecting a good (safe) yield (ignoring nominal vs real for the moment). Using market profits to compound your initial investment.

So originally I was simply going to compare apples to apples: ie. Mr Skates Top 20 vs ASX market represented via EWA. Australian instruments are quite limited.

I wanted (to increase returns) to sell covered CALLS on the stock.

This QYLG is exactly that strategy, selling covered CALLS on 50% of its stock holdings.

BIL is short term Bills returning a yield. Far better than just sitting in cash.

So I will run both strategies.

Hypothetical $100K

QYLG = $20K
BIL = $80K

View attachment 178847View attachment 178846


So:

QYLG = 630 shares = $19,971.00
BIL = 873 shares = $79,984.26

Total = $99,955.26
Cash = $44.74

This will now run alongside the EWA experiment.

So QYLG:

View attachment 178850View attachment 178849

BIL

View attachment 178852View attachment 178851


jog on
duc
In Australia,YMAX is an interesting ETF
See https://www.livewiremarkets.com/wir...u-beat-inflation-and-earn-an-extra-4-in-yield
Mr @ducati916 will note their use of covered calls..
 
#1. Logo.jpg
Advantages of Daily Trading
The speed, control, and risk management of daily trading can be a powerful edge. The trade-off is the necessity for daily monitoring, a minor concession for the 4 benefits listed below.

1. Prompt Response Times - Quickly adapt to shifting market signals
2. Risk Mitigation - Rapidly exit losing trades to limit downside
3. Greater Flexibility - More frequent trading opportunities
4. Reduced Emotional Strain - The ability to cut losses quickly lowers stress

Current trade exits
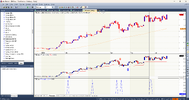
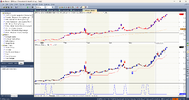
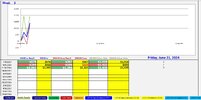
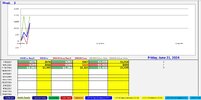
The MACD trading strategies over the past 3 weeks have demonstrated timely exits.

Daily Sales.jpg

Skate.
 
#1a. MACD-sv Logo.jpg

The (1. MACD-sv Strategy) is an adapted MACD-v indicator
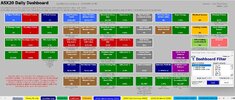
This hypothetical trading exercise is the first of three MACD trading strategies under review. This strategy is designed to trade 20 large ASX companies as of the 1st of June 2024. The (MACD-sv Portfolio) is diversified across 10 holdings, each allocated $10,000, capping the total of each strategy at $100,000. This ongoing exercise will provide a clear assessment of the relative merits of this trading strategy.

Currently in profit
The "MACD-sv Strategy" has generated a profit of $1,395 in the first 3 weeks of implementation which is pleasing.

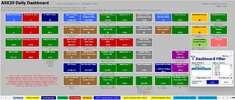
#1b. MACD-sv Dashboard.jpg


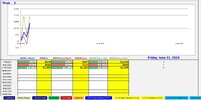
#1ba. Weekly Result.jpg


#1c. MACD-sv Open Summary.jpg


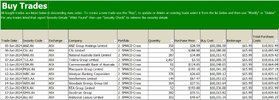
#1d. MACD-sv Buy Trades.jpg


#1e. MACD-sv Sell Trades.jpg

Skate.
 
#2a. SMACD-Cross Logo.jpg

The (2. SMACD-Cross Strategy) is adapted from a Smoothed MACD indicator

This hypothetical trading exercise is the second of three MACD trading strategies under review. This strategy is designed to trade 20 large ASX companies as of the 1st of June 2024. The (SMACD-Cross Portfolio) is diversified across 10 holdings, each allocated $10,000, capping the total of each strategy at $100,000. This ongoing exercise will provide a clear assessment of the relative merits of this trading strategy.

The smoothed MACD is currently in profit
The "SMACD-Cross Strategy" has generated a profit of $1,165 in the first 3 weeks of implementation which is pleasing.

#2b. CROSS Dashboard.jpg


#2ba. Weekly Result.jpg


#2c. CROSS Open Summary.jpg


#2d. CROSS Buy Trades.jpg


#2e. CROSS Sell Trades.jpg

Skate.
 
#3a. SMACD-Colours Logo.jpg

The (3. SMACD-Coloured Strategy) is adapted from a Smoothed MACD indicator

This hypothetical trading exercise is the third of three MACD trading strategies under review. This strategy is designed to trade 20 large ASX companies as of the 1st of June 2024. Triggering buy and sell signals based on the colour changes of the Smoothed MACD line. Buy on the next bar after the signal bar. The (SMACD-Coloured Portfolio) is diversified across 10 holdings, each allocated $10,000, capping the total of each strategy at $100,000. This ongoing exercise will provide a clear assessment of the relative merits of this trading strategy.

The SMACD-Colour Dots Strategy Generates Promising Results
The "SMACD-Colour Dots Strategy" has generated a profit of $1,929 in the first 3 weeks, which is a pleasing outcome. This strategy is more active compared to the other two approaches.

#3b. COLOURS Dashboard.jpg


#3ba. Weekly Result.jpg


#3c. COLOURS Open Summary.jpg


#3d. COLOURS Buy Trades.jpg


#3e. COLOURS  Sell Trades.jpg

Skate.
 
1. AI v Human Logo.jpg
Explanation
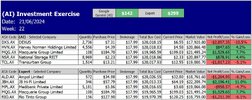
This is a theoretical investment exercise comparing the stock selection of expert fund manager Dr. Don Hamson and Google (AI) Gemini. Both provided their top 5 growth and income stocks for the ASX over the next 12 months.

Results
1st Place $299: Dr. Don Hamson (Expert) - BLUE line on the equity chart (2 winning positions)
2nd Place $142: Google Gemini (AI) - RED line on the equity chart (3 winning positions)

2. SummaryResult.jpg


3. WeeklyUpdate.jpg

Skate.
 
Food for thoughts
Looking at the expert vs AI
The asx XJT was at 96233 on 02/01/24
it closed on friday at 100,030.50
a move up of 3800 point or 3800/96233=> 3.9%
during that time both expert and AI hardly managed to stay positive;
That is a bit scary and a big push to invest into indexes, I feel lucky with my super choices matching XJT looking at this

@qldfrog the results from both are disappointing but when you think about the initial rule of picking 5 growth stocks over a 12 month period was an ambitious project.

Skate.
 
So the 'experiment' was for the best (most profitable) method for long term investing and avoiding the frenetic chaos of day trading and reducing the effort required in position trading (weekly systems).

There is the 'buy and hold' method, where once stocks selected, you sit back passively, collect dividends and land where you land.

My strategy is an 'inbetween' strategy. Limited trading, once a month possibly even less depending on market volatility. Collecting a good (safe) yield (ignoring nominal vs real for the moment). Using market profits to compound your initial investment.

So originally I was simply going to compare apples to apples: ie. Mr Skates Top 20 vs ASX market represented via EWA. Australian instruments are quite limited.

I wanted (to increase returns) to sell covered CALLS on the stock.

This QYLG is exactly that strategy, selling covered CALLS on 50% of its stock holdings.

BIL is short term Bills returning a yield. Far better than just sitting in cash.

So I will run both strategies.

Hypothetical $100K

QYLG = $20K
BIL = $80K

View attachment 178847View attachment 178846


So:

QYLG = 630 shares = $19,971.00
BIL = 873 shares = $79,984.26

Total = $99,955.26
Cash = $44.74

This will now run alongside the EWA experiment.

So QYLG:

View attachment 178850View attachment 178849

BIL

View attachment 178852View attachment 178851


jog on
duc
Screen Shot 2024-06-22 at 4.41.52 PM.pngScreen Shot 2024-06-22 at 4.42.14 PM.png

QYLG = 630 shares = $19,941.30
BIL = 873 shares = $80,054.10

Total = $99,995.40
Cash = $44.74

Screen Shot 2024-06-22 at 4.41.22 PM.png

Shares = 2432
Value = $59292.16
Cash = $40,000

jog on
duc
 
1. ASX20 LOGO.jpg
Objective
This exercise aims to explore a hypothetical scenario of investing $5,000 in each of the 20 companies currently listed in the ASX20 index, with a start date of the 1st of July 2023. The aim is to determine the year-to-date returns, including capital gains and dividends, of this $100,000 investment.

3. SUNDAY POST - ASX20 Buy and Hold Strategy.jpg

Skate.
 
The Countdown Begins
As we approach the final week of the financial year, it's time to pause and reflect on the journey of the past 12 months. This year has been transformative, to say the least. My transition from trading to investing wasn't without its challenges. In fact, it might not have been my finest hour. However, this shift taught me a valuable lesson regardless of my approach that success in the financial markets is less about the method and more about the mindset.

Skate.
 
Top