Australian (ASX) Stock Market Forum

Dump it Here

1. ASX20 LOGO.jpg
Objective
This hypothetical investment exercise measures the performance of Australia's top 20 listed companies as of the 1st of May 2024. The aim is to explore the year-to-date returns of investing $100,000 ($5,000 in each of the 20 companies) from the 1st of July 2023, considering capital gains and dividends. The ASX20 investment strategy is rebalanced annually to simplify the process. It's important to note that survivorship bias was introduced in the initial analysis. The primary goal of this exercise is to demonstrate a streamlined approach for newcomers to participate in the markets easily.

Exercise end date
The final post for this exercise will be presented on Sunday the 30th of June 2024.
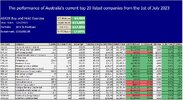
3. SUNDAY POST - ASX20 Buy and Hold Strategy.jpg

Skate.
 
View attachment 178372
Objective
This hypothetical investment exercise measures the performance of Australia's top 20 listed companies as of the 1st of May 2024. The aim is to explore the year-to-date returns of investing $100,000 ($5,000 in each of the 20 companies) from the 1st of July 2023, considering capital gains and dividends. The ASX20 investment strategy is rebalanced annually to simplify the process. It's important to note that survivorship bias was introduced in the initial analysis. The primary goal of this exercise is to demonstrate a streamlined approach for newcomers to participate in the markets easily.

Exercise end date
The final post for this exercise will be presented on Sunday the 30th of June 2024.

View attachment 178373

Skate.
professor, You are a legend.
 
As an active investor, I've found myself still yearning for the thrill of trading the markets
My next endeavour is to explore the possibility of trading the same companies listed in my ASX20 investment strategy using free software.

The standard MACD (Moving Average Convergence Divergence) is a powerful technical indicator, but it does have its limitations. It's about striking the right balance by allowing a modified MACD to adapt to market volatility to generate more reliable signals. To that end, I've made some adjustments to the MACD-v (MACD-Volatility) code. I've incorporated a unique approach for evaluating volatility, and have also enhanced the visual clarity on the charts.

It's understandable that newcomers to trading may be eager to get started, yet hesitant to invest in the necessary tools, such as a data and charting package. That's why I've chosen to rework the MACD using TradingView, which is a "free" charting program. By combining my customised MACD-v approach with the accessibility of TradingView, I believe I can uncover opportunities within the ASX20 that may have been previously overlooked. As I embark on this exciting journey, I'm planning to share my findings along the way.

Skate.
 
Exploring a New Daily Strategy for Trading the ASX20
I'm excited to delve into trading the ASX20 using free software. After receiving a recommendation from @peter2, I've decided to evaluate a modified version of the MACD-v strategy developed by Alex Spiroglou to assess its effectiveness and reliability for trading the ASX20. By analysing the system's performance, I aim to gain valuable insights into its potential and determine whether it is a viable trading strategy.

Implementing the MACD-v in TradingView
For this exercise, I will implement my modified version of the MACD-v indicator in the TradingView free platform. The portfolio will consist of 10 positions, each with a $10,000 investment, resulting in a total investment ceiling of $100,000. As the ASX20 investment strategy is drawing to a close, I will compare the performance of MACD-v to a simple buy-and-hold approach for the same set of ASX20 companies. This comparison will provide a clear assessment of the relative merits of trading the ASX20 using the MACD-v strategy.

Skate.
 
Trading the ASX20 using a "Daily" Strategy
To ensure a fair and unbiased assessment, I have begun a hypothetical trading exercise starting on the 1st of June 2024 (the start of last week), avoiding any potential cherry-picking that could skew the ongoing results. While I could have delayed this exercise until the rebalancing of the ASX20 was complete, the specific signal I'm trading is not critical to the process. Therefore, I have elected to use the same signals that are currently listed in my existing ASX20 investment strategy, keeping things simple and allowing a natural progression from an investment approach to a trading strategy.

Skate.
 
Trading the ASX20
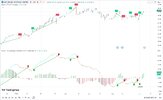
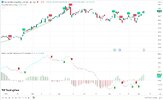
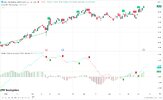
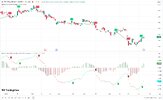
The chart below showcases the standard MACD signals, with the lower section highlighting the updated MACD-v signal that adapts to market volatility. This MACD-v signal will be the primary focus of our analysis. The green plot represents the MACD-v signal, and the buy occurs on the next trading day opening. Through this exercise, I seek to explore the potential of this simple yet promising strategy.

Reading the Chart
The lower half of the chart is what I will be concentrating on is the signals from "Alex Spiroglous Update MACD-v Indicator. The top section of the chart displays has no relevance other than displaying the standard MACD signals. When I paste charts in future, I will delete the joining green line on the MACD-v chart as @DaveTrade remarked it presents an unclear image of the trade result.

ANZ.jpg

Skate.
 
#1. Logo.jpg

Trading the MACD-v in TradingView
This hypothetical trading exercise aims to measure the performance of trading 20 listed companies as of the 1st of May 2024 using a modified version of the MACD-v indicator in the TradingView free platform. The portfolio will consist of 10 positions, each with a $10,000 investment, resulting in a total investment ceiling of $100,000.

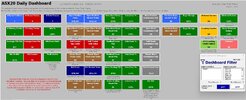
2. Dashboard.jpg


3. Weekly Result Week 12.jpg


5. Buy Trades.jpg


4. Open Summary.jpg

Skate.
 
#1. Logo.jpg

The Original Buy Signals
To begin, I will display the buy signals for the companies added to the hypothetical trading exercise.

This structured approach will provide a clear and transparent overview of the entry criteria being utilised, setting the foundation for the ongoing analysis and tracking of the trading strategy's performance.

By displaying the buy signals, I aim to ensure a comprehensive understanding of the decision-making process underpinning the trade executions. This level of detail will enable a more meaningful evaluation of the strategy's potential.

ANZ
ANZ.jpg


CBA
CBA.jpg


CSL
CSL.jpg


MQG
MQG.jpg


NAB
NAB.jpg


QBE
QBE.jpg


TLS
TLS.jpg

Footnote
There is one buy signal for Tuesdays open.

Skate.
 
Trading PANDA Capture.jpg

I've received an unusual request that I would like to address
In the past, I have included a link to my eBooks at the bottom of my forum posts, purely as a convenience for interested readers. However, I was recently asked if I have an audio version of my "Trading Panda" eBook available.

To accommodate this request, I have now created an audio copy of the eBook in MP3 format. If anyone else would like access to this audio version, I will be happy to provide a link to it below. The download will be available until the 8th of July 2024

Skate's Trading PANDA Audio eBook.mp3

Click to Download

Skate.
 
The standard MACD (Moving Average Convergence Divergence) is a powerful technical indicator, but it does have its limitations. It's about striking the right balance by allowing a modified MACD to adapt to market volatility to generate more reliable signals. To that end, I've made some adjustments to the MACD-v (MACD-Volatility) code. I've incorporated a unique approach for evaluating volatility, and have also enhanced the visual clarity on the charts.
@Skate if you have changed the volatility part of the MACD-V formula and made an improvement to the indicator, are you prepared to share your improvement? I understand if this is something that you would rather not share on the forum but I thought I'd ask the question.
 
@Skate if you have changed the volatility part of the MACD-V formula and made an improvement to the indicator, are you prepared to share your improvement? I understand if this is something that you would rather not share on the forum but I thought I'd ask the question.

@DaveTrade, thank you for your request. While I prefer not to provide or share any specific code, I'm happy to explain the differences between the two methodologies for calculating volatility. That way, you can take the information and code and test the approaches yourself.

In my "Modified Spiroglous MACD-v indicator," I calculate volatility using a modified approach that incorporates the concept of standard deviations. By assessing the standard deviation of the MACD-v values over a specified length, my indicator captures the variability of the MACD-v indicator, providing insights into market volatility. This method allows me to identify potential momentum shifts and visualise volatility-related patterns, enhancing the analysis. This calculation is a key component in my modified MACD-v indicator and plays a crucial role in assessing market momentum and potential trading signals.

On the other hand, the original "Alex Spiroglous MACD-V indicator" calculates volatility by integrating the Average True Range (ATR) into the MACD-V formula. By leveraging the ATR, the indicator effectively accounts for market volatility in its analysis. While my approach utilises standard deviations to measure volatility, the original "Alex Spiroglous MACD-V indicator" leverages the ATR to capture and integrate volatility into its calculations.

The distinction in methodologies, with my approach leveraging standard deviations and the original indicator utilising the ATR, showcases the adaptability of the MACD-V concept. This versatility allows for diverse interpretations and implementations tailored to specific trading strategies and preferences, highlighting the depth and flexibility of volatility measurement within the context of the MACD-V framework.

Skate.
 
Deciphering the (MACD-sv) vs Spiroglous MACD-v indicator
After replying to @DaveTrade, I received a few other questions and one suggestion. When discussing my version of the MACD-v, I will refer to it as (MACD-sv) to clarify the distinction. My modified version, (MACD-sv), is a variation of the traditional MACD indicator that has been enhanced to include a third parameter. This parameter involves volatility and standard deviation, incorporating bands that provide a unique perspective on market momentum and potential price movements.

Spiroglous MACD-v indicator, a volatility-normalised version of the MACD, aims to stabilise the indicator across various securities and timeframes. It addresses some limitations of the traditional MACD by normalising volatility, which is not accounted for in the standard MACD.

I prefer to use my modified version, the (MACD-sv) over "Spiroglous MACD-v" due to its specialised volatility measurement and the inclusion of standard deviation bands in assessing momentum shifts. The (MACD-sv) emphasises volatility through the integration of standard deviation bands, providing a unique analysis of momentum shifts. This unique value of the (MACD-sv) brings an additional layer of momentum analysis.

Skate.
 
Deciphering the (MACD-sv)
I'm unsure if I'm overcomplicating this simple exercise but it is worth making a few additional comments to questions I've received.

The numbers on the right side of the chart
What do these numbers mean and why the different colours?

ALL - BOX COLOURS.jpg


GMG - BOX COLOURS.jpg

Short explanation
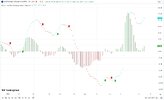
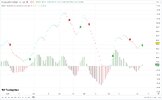
The numbers on the chart represent the (MACD-sv) values, which reflect the momentum and volatility of the movement. These numbers are part of a comprehensive analysis rather than having value in isolation.

Magnitude of Movement
The numerical value of the (MACD-vs) indicates the magnitude of the price movement relative to the trend and volatility. A higher number suggests a stronger upward momentum, while a lower number indicates a stronger downward momentum.

Directional Bias
The colour of the number (aqua, red, yellow or green) provides a quick visual cue about the direction of the trend. The interpretation of these numbers should be in the context of the overall market conditions. There is no absolute 'better' value, rather, it's about how the number fits into the broader analysis.

Skate.
 
Deciphering the (MACD-sv)
I'm unsure if I'm overcomplicating this simple exercise but it is worth making a few additional comments to questions I've received.

The numbers on the right side of the chart
What do these numbers mean and why the different colours?

View attachment 178453


View attachment 178454

Short explanation
The numbers on the chart represent the (MACD-sv) values, which reflect the momentum and volatility of the movement. These numbers are part of a comprehensive analysis rather than having value in isolation.

Magnitude of Movement
The numerical value of the (MACD-vs) indicates the magnitude of the price movement relative to the trend and volatility. A higher number suggests a stronger upward momentum, while a lower number indicates a stronger downward momentum.

Directional Bias
The colour of the number (aqua, red, yellow or green) provides a quick visual cue about the direction of the trend. The interpretation of these numbers should be in the context of the overall market conditions. There is no absolute 'better' value, rather, it's about how the number fits into the broader analysis.

Skate.
@Skate I can see that you are attempting to do all the trade analysis with the one indicator, I am sceptical if this can be done but am therefore very interested in the results of your testing. If it works it will be groundbreaking, thanks for sharing.
 
@Skate I can see that you are attempting to do all the trade analysis with the one indicator, I am sceptical if this can be done but am therefore very interested in the results of your testing. If it works it will be groundbreaking, thanks for sharing.

@DaveTrade you make a very valid point. This exercise was to determine if a new trader could use a simple strategy using free software. My first suggestion was to have the new trader buy the entire ASX20 with trading funds equally spread over those twenty companies until they gain more experience.

Some new traders simply want to trade rather than invest until they get an education under their belt. The recent exercise is to show an alternative to investing in the top 20 companies, but rather trading them using not one, but three indicators. The sturdy MACD, the volatility-enhanced MACD-v indicator, and my version (MACD-sv) add a new way to measure volatility by incorporating momentum.

Being sceptical is all part of evaluating the ideas of others. Will this strategy be profitable? Who knows? But it's a novel idea to understand this trading idea with few moving parts, and TradingView has a wealth of scripts. The reason I decided on the MACD-v suggested by @peter2 is that the original MACD had limitations that Spiroglou's MACD-v indicator overcame. All I have done is calculate the volatility differently and add momentum to the mix.

As with you, I'll be interested in the ongoing results, even though I'll be trading this strategy daily, which I'm not too thrilled about, as my comfort zone is trading weekly. I chose a daily strategy over a weekly one because @qldfrog keeps remarking that exiting early is the key to profitability, and daily trading allows this, rather than waiting for the week to end before taking action.

Skate.
 
Another question I wish to address
Why not consider companies not currently on the buy list? Going on to remark that as there is a maximum of 20 companies to trade it was suggested that I consider a few companies that are currently performing well, being (ALL), (TCL) and (WOW). All three companies are currently in a trade. So until a new buy signal is generated, we will be sitting on our hands.

(All)
Is currently in a trade.

ALL - Currently in a position.jpg


(TCL)
Is currently in a trade.

TCL - Currently in a position.jpg


(WOW)
Is currently in a trade.

WOW - Currently in a position.jpg

Skate.
 
If you decide to trade trends then you'll need tactics to identify acceptable risk:reward setups. We want to enter a trend near the start, perhaps add soon after and then hang on while the trend persists and sell when the trend falters.

Trading systems all have trading rules
@peter2's remarks in the above quote add value to the discussion about entering at the start of a trend versus waiting for subsequent buy signals. Taking other than the first buy signal adds complexity to my trading style.

Benefits of Taking the First Buy Signal
Taking the first buy signal allows you to maximise the profit potential if one exits. The first buy signal occurs at the beginning of a potential upward trend, which means entering a trade at this point could allow you to capture the full extent of the price movement. The first buy signal is typically generated when the momentum shifts from bearish to bullish, suggesting that the market sentiment is turning favourable, where the most significant price movements often occur.

Skate.
 
Buying After the First Buy Signal
Don't consider it a missed opportunity if you miss the first buy signal, as you might enter the trade at a less optimal price, which could reduce your profit margin. As the trend progresses, the momentum may decrease, making later entry points potentially less profitable. The longer you wait after the first buy signal, the closer you might be to a potential sell signal or trend reversal, which could increase the risk of the trade.

Disadvantages of Buying After the First Buy Signal
There might be psychological pressure to "catch up", which can lead to rushed decisions and poor risk management. After consideration, if you want to enter a trend after the start, it's perhaps better to do so sooner rather than later, as @peter2 suggests, and sell when the trend falters.

Skate.
 
Top