Australian (ASX) Stock Market Forum

Dump it Here

Skate, you've done a bit of work using the MACD in your systems trading.

I want to mention some work done by Alex Spiroglou. He's developed an indicator based on the MACD called MACD-v (volatility normalised momentum). This indicator is unbounded and it's values can be compared across markets (stocks).

I think you may find this indicator more useful in your trading systems. Definitely worth some research.

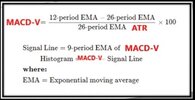
Edit: Added formula from one of Alex's presentations.

View attachment 176632

@peter2, I appreciate your valuable contribution in sharing information about the volatility normalized momentum indicator (MACD-v). The graphic you provided presents a straightforward formula that is easily comprehensible, simplifying the process of coding it in platforms like Amibroker or Trading View. Even for non-coders, it is as simple as transforming an idea into a mathematical formula, which can be interpreted as code by a program.

Converting this formula into an indicator is a straightforward task. However, transforming that indicator into a trading strategy requires a bit more effort. By conducting backtesting, we can assess whether the idea is worth further development and implementation.

Exploring Alex Spiroglou's idea through a series of posts could indeed hold educational value. However, it is important to present the information across multiple posts to ensure a comprehensive understanding of not only this particular idea but also how it can be combined with different indicators to yield similar results.

It is worth noting, as a disclaimer, that many people often attempt to reinvent the wheel and reimplement well-established concepts as if they were novel and groundbreaking.

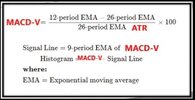
Alex Spiroglou's MACD-v code is represented by this mathematical equation
MACD-v Mathematical.jpg

Skate.
 
Converting this formula into an indicator is a straightforward task.

Alex Spiroglou's MACD-v code is an Indicator
I would like to express my sincere appreciation for the valuable contributions made by @qldfrog, @Miner, @Ferret, @divs4ever, @UMike, @Sean K, @JohnDe, @DrBourse, @Garpal Gumnut, @Dona Ferentes, and @peter2 in the WDS-woodside-energy-group thread. As I currently hold a position in WDS, I will utilise (WDS) as an example to share information regarding the volatility normalized momentum indicator (MACD-v).

The MACD-v (mathematical formula)

MACD-v Mathematical.jpg

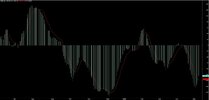
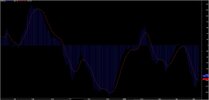
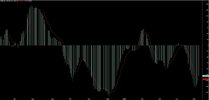
What does the MACD-v Indicator look like?
Let's take a look at the daily chart of (WDS) Woodside Energy Group below. Now, the question arises - How can we utilise this indicator to develop a trading strategy that can be thoroughly tested to determine its effectiveness and whether it merits further development?

Based on feedback, it has been suggested that Aqua is easier to see than Blue. With this in mind, I will provide both charts, each displaying the indicator in a different colour, to accommodate personal preferences and enhance visibility.

MACD-v AQUA Indicator.jpg


MACD-v BLUE Indicator.jpg

Skate.
 
Where is the educational value in continuing to post disappointing results after 16 weeks?
i have found flawed strategies ( when you realize they have failed ) are very educational they lead to questions of what went wrong

was it the selection of comparisons , maybe the whole thesis , maybe the outcomes expected ( the truth can be very unpleasant )

also factor in the experiment has not run it's full course , and this could turn out to be a very atypical year

i decided share-investing is very much 'a numbers game ' throw enough darts and you should get some successes , but in refining the dart throwing how many ( potential ) successes are culled along with the likely failures

may i cite two of my unlikely successes ( both penny dreadfuls when bought ) AAO ( now EML ) OTE ( last listed as ISX ) both way more than 10-baggers for me but both 're-inventing themselves ' to do so

and neither took a decade to yield those turn-arounds

given the many changes currently working their way through the market is it too early to declare a lack of educational material ?
 
How can we utilise this indicator to develop a trading strategy

The MACD-v Indicator - Enhancing Visualization for Buy and Sell Positions
To transform Alex Spiroglou's volatility normalised momentum indicator (MACD-v) into a more visually informative tool, we seek to improve its representation by clearly indicating the buy and sell positions on the indicator itself. By doing so, we can enhance our understanding of the indicator's signals and facilitate decision-making.

To achieve this, we can explore various techniques such as adding color-coded markers or highlighting specific regions on the indicator that correspond to buy or sell positions. Additionally, incorporating visual cues like arrows or vertical lines and coloured dots can further emphasise these key points.

By implementing these enhancements, we can create a more intuitive and user-friendly representation of the (MACD-v) indicator, allowing traders to easily identify and interpret the buy and sell positions within the indicator's readings.

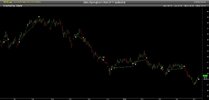
Below is an Amibroker Chart
I'll switch from Amibroker to Trading View (a FREE platform) to display the (MACD-v) indicator as a visual representation.

MACD-v AQUA Indicator.jpg


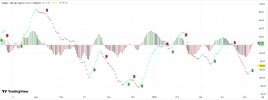
Below is a TradingView chart featuring the (MACD-v) indicator

I have changed charts from Amibroker to TradingView, a free platform to show Alex Spiroglou's MACD-v indicator with buy and sell signals.

In this visual representation
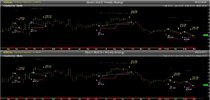
(a) The "upper" part (the sell signals) showcases instances when Alex Spiroglou's volatility normalised momentum indicator is (True) representing a curve to some degree by the display by the red down boxes.
(b) The "lower" part (the buy signals) showcases instances when Alex Spiroglou's volatility normalised momentum indicator is (True) representing a curve to some degree by the display by the green up boxes.

This approach focuses on identifying patterns that do not necessarily require a deep understanding of the indicator's inner workings, but rather highlight when it proves effective on the specific stock - in this case (WDS).

MACD-v Signals WDS.jpg

Skate.
 
Let's improve the readability of the signals
Information can always be improved to display an indicator in different ways and by doing so, we can enhance our understanding of the indicator's signals to make better decisions.

From this
Alex Spiroglou's volatility normalised momentum indicator is (True) representing a curve to display when the (MACD-V) is true.

MACD-v Signals WDS.jpg

To This
A much cleaner representation of the first buy and sell signal.

MACD-v IMPROVED Signals WDS.jpg

Skate.
 
The (MACD-V) Indicator - Transforming into a Trading System
Now, let's proceed with the task of converting Alex Spiroglou's volatility-normalized momentum indicator into a comprehensive trading system that displays signals on the chart of (WDS). This conversion will enable us to observe how this indicator performs as a trading strategy.

However, the crucial question that remains
How does this indicator, once transformed into a trading system, actually perform? Answering this question will allow us to evaluate the effectiveness and reliability of this trading approach. By analysing the system's performance, we can gain valuable insights into its potential and determine whether it is a viable strategy for trading (WDS) or any other relevant stocks.

Amibroker MACD-v Chart.jpg

Skate,
 
At first glance, the (MACD-v) indicator shows promise as a trading strategy
To summarise its calculation, the (MACD-v) is derived by normalizing the difference between the exponential moving averages (EMAs) using the 26-period EMA multiplied by the average true range (ATR) and then scaling it by multiplying by 100. The chart in my previous post displays the signals for (WDS), but it's important to note that we trade with a diverse range of companies.

To ensure a fair assessment
I will conduct a comprehensive backtest of this (MACD-v) trading system across the ASX200. By focusing on the top 200 companies listed on the ASX, we can minimise potential risks and alleviate concerns if the indicator fails to perform as expected. This approach aims to make trading less daunting and more manageable while still allowing for a broad range of investment opportunities.

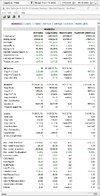
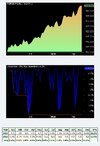
The Backtest results
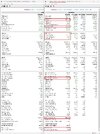
The period of the backtest is the dates on the charts (1st July 2023 to the end of trade Yesterday). The filter is set to the ASX200.

Backtest Top.jpg


Backtest Equity.jpg

Yes
@peter2 suggestion to check out Alex Spiroglou's volatility-normalized momentum indicator get a "big green tick" from me

Green tick of approval.jpg

Skate.
 
Thank you, @peter2, for your valuable contribution. I appreciate the time you took to share important information about the volatility normalized momentum indicator (MACD-v). The formula you presented in your graphic is not only simple but also easily comprehensible, making it a straightforward task to code in platforms like Amibroker or TradingView. Your insights have undoubtedly made the process much easier and more accessible for others looking to implement this indicator in their trading strategies.

Mastering Trading with the (MACD-v) Indicator
Navigating the question of what to buy and when to sell can be simplified using a single, powerful indicator, the 'Moving Average Convergence Divergence' (MACD-v). Using the volatility-normalized momentum indicator as a trading system makes the act of buying and selling seem straightforward. This is where the (MACD-v) truly shines, providing clear signals that can guide your selling decisions.

The Moving Average Convergence Divergence volatility-normalized momentum (MACD-v) is one such tool that fits the bill perfectly. It simplifies the process by precisely handling both entry and exit points. This approach not only enhances the efficiency of trading but also makes it accessible to everyone, regardless of their level of experience.

If interested you can read more about Alex Spiroglou's volatility-normalized momentum indicator here:


It's time to hop off my soapbox
Soapbox Capture.PNG
Skate.
 
Hello @Joe Blow
Could you please create a new thread with stock code DOR ? The name will be changed to Asian Battery Minerals and Hot Copper is pushing a small section of IPO.
The full prospectus is 469 pages and would exceed the 2 MB limit for attachment.
Hello Team
Has any one already researched on this IPO ? Too many battery minerals and at 5 cents per share, this may not fly. Your thoughts please

1715401435995.png
1715401530975.png
 

Attachments

  • PART Prospectus (DOR) - FINAL - 290424 - Offer Website.pdf- short.pdf
    6.6 MB · Views: 2
Hello @Joe Blow
Could you please create a new thread with stock code DOR ? The name will be changed to Asian Battery Minerals and Hot Copper is pushing a small section of IPO.
The full prospectus is 469 pages and would exceed the 2 MB limit for attachment.
Hello Team
Has any one already researched on this IPO ? Too many battery minerals and at 5 cents per share, this may not fly. Your thoughts please

View attachment 176696
View attachment 176697

There is already a DOR thread. When the company name is changed I will just re-title that thread accordingly.
 
Yes they look the same when compared on the one chart. However the MACD has a few limitations.

1. The MACD is not comparable across time.
2. The MACD is not comparable across securities.
3. The MACD momentum readings cannot be objectively scaled.
4. The signal line crossovers are unreliable in low momentum environments. One cannot objectively define these low momentum levels with the MACD.
5. MACD crossover signals are late in high momentum trend reversals.

The MACD-V overcomes these limitations.

The MACD-V of any security can be plotted on the same axis. The MACD-V ranges are the same for all securities and the MACD-V values are comparable across all securities.

All markets show similar exhaustion levels when momentum is 1.5 times its volatility (>150, <-150).
Low momentum zones can be defined in all charts (50 to -50).

The MACD-V makes it possible to scan all securities to find the type of momentum we're interested in finding.

The MACD-V is not a stand alone indicator for basing a trading system on. However It's effectiveness is enhanced with a higher timeframe or market trend filter. Alex Spiroglou suggests combining the MACD-V with a 200ma trend filter to improve it's effectiveness. IMO I think @Skate market percentage filter will work even better as it's much quicker to identify the current trend.

macdv2.PNG

"This opens up new and unexplored opportunities to use the MACD. Up until today the MACD could be used either in 2 ways, either above/below the signal line, and/or above/below the 0-line. The MACD-V now presents us with 8 different scenarios to explore, and of course these are multiplied in the case of cross asset comparisons"

We can also create a MACD-V histogram and this shows ranges from +40 to -40 across all securities.
 
View attachment 176672

Where is the educational value in continuing to post disappointing results after 16 weeks?
It is rather embarrassing, and I find it disheartening that there seems to be no educational benefit in this exercise. I'm beginning to question the initial premise of this endeavour, as it appears to have been flawed from the outset. This experiment has demonstrated that none of us possess the ability to predict the future with certainty. Simply sharing these results requires minimal effort, as Excel performs all the calculations with a single CommSec export. If this exercise proves to be helpful or enjoyable for others to follow along, I will continue to share the progress.

# Disclaimer - This is a theoretical investment exercise
In this exercise, we put "Google (AI) Gemini" head-to-head with seasoned fund manager Dr. Don Hamson from Plato Investment Management. Both were tasked with providing their "top five growth and income stocks" for the next 12 months on the ASX.

First Place $229
# Dr. Don Hamson (Expert) - BLUE line on the equity chart

Second Place -$825
# Skate - BROWN line on the equity chart

Third Place -$1,259
# Google Gemini (AI) - RED line on the equity chart

View attachment 176673

View attachment 176674

Skate.
I believe there is a learning experience here: AI doing a fantastic job in the first..what..3 months...then turning into random results..maybe we should use AI every 2 months. . And reduce expectations ..obviously, need to do further research.
 
Sharing Knowledge and Reinforcing Concepts
I receive numerous inquiries from individuals seeking information to improve their trading profitability, just like many others in the trading community. I must confess that I am sometimes guilty of leveraging our member's experiences to emphasise the importance of trading effectively. It's essential to recognise that trading is a complex endeavour that requires knowledge, skill, and discipline.

Tennis
Take @peter2 I use the analogy of tennis. I can't help but draw a parallel with tennis. Just like in tennis, it's not about a single trade but about consistently winning more than losing, just as winning a tennis match requires winning more games. To succeed in tennis you must continuously practice to enhance your skills and refine your abilities through continuous learning and hands-on experience. Like tennis, trading is an ongoing process of improvement and adaptation.

Sailing
@Captain_Chaza, a seasoned trader who approaches the markets with a captivating nautical flair. Drawing inspiration from the world of sailing, Captain Chaza understands that trading, much like sailing, demands a unique blend of intuition, preparation, and adaptability. Just as a skilled sailor faces the unpredictable seas, our captain knows that the market can be equally tumultuous. By combining the wisdom of a seasoned sailor with the precision of a trader, Captain Chaza takes control of the trading waters, ready to navigate the financial seas with skill, knowledge, and a keen eye for potential gains.

Boxing
Over the years, I have found boxing to be a fitting analogy for trading. Just like in boxing, you never step into the ring without being fight-fit. It takes extensive training and preparation to reach a stage where you can enter the ring with confidence. Similarly, in trading, you must invest time and effort in honing your skills before you step into the ring. You need a well-thought-out plan and a strategic approach. Just as a boxer knows when to throw a punch, as a trader, you must know when to execute your trades. Additionally, like a boxer who must be prepared to absorb some pain, traders should be mentally prepared to handle setbacks and losses.

In summary
While it is natural to seek guidance and insights from others, it's crucial to approach trading with a sense of personal responsibility. Relying solely on others can be risky and may hinder long-term success.

Skate.
 
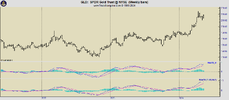
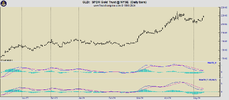
@Skate and @peter2 , I put the MACD_V and the standard MACD up on a chart of GLD and they do look very similar on this chart, see below;
View attachment 176711
View attachment 176712

@DaveTrade, looking at your chart is very convincing but as @peter2 replied there are so many differences between the standard (MACD) in comparison to Alex Spiroglou's "Moving Average Convergence Divergence Volatility Normalized Momentum" (MACD-v).

Unlike the regular (MACD), which dances to its own beat, the (MACD-v) adjusts its moves based on market volatility. It’s like having a dance partner who adapts to the rhythm of the music. Next time you’re analysing charts, consider both "MACD flavours". Whether you’re Team Vanilla or Team Volatility, remember, the market’s rhythm is ever-changing so as a trader you need to adjust your steps accordingly.

Comparing the (MACD) to the (MACD-v) on the WDS chart
At first glance, the differences are not that apparent. But a backtest between the two and the differences emerge telling a different story. Why? For the reasons, @peter2 explained. The standard (MACD) can lag behind price movements. It’s like chasing a train that’s already left the station. But the (MACD-v) adapts faster, like a sprinter anticipating the starting gun.

Comparison Chart.jpg


Nimble as a Ninja
The MACD-v’s sensitivity to divergences, those subtle shifts in price and momentum, makes it a ninja in spotting trend reversals as the backtest reveals. The backtest is from 1/7/2023 to the present. The Filter is set to the All Ordinaries with the same settings other than the buy and sell conditions. Team Vanilla (MACD) is the backtest on the left and Team Volatility (MACD-v) is on the right.

Comparison Top.jpg

Skate.
 
The values of a regular MACD don't mean anything. When we're looking at it on a chart we can see if it's going up or down.

However the values of the MACD-V are meaningful on all charts. eg a MACD-V between 50 -150 tells me that the market is going up. Once the MACD-V becomes greater than 150 I know it's overextended.

Knowing that these values are meaningful across markets allows me to scan my charts to find all markets/stocks that have recently started to trend higher.

Skate's Keltner Channels-MACD Strategy
@peter2 sharing ideas is what this thread is all about. Each of us has our unique methods and approaches to achieve profitability in the markets. It's important to acknowledge that sometimes I attempt to reinvent the wheel and reimplement well-established concepts, thinking they are novel and groundbreaking. However, there are also instances where exploring novel ideas can yield substantial rewards.

In my trading journey
I have dedicated significant time and effort to developing the "Keltner Channels" and the (MACD) indicator. Through this process, I have created the KC-MACD strategy, which is a powerful adaptation of the traditional (MACD indicator) and very similar to the (MACD-v) idea previously discussed. In a nutshell, the KC-MACD strategy incorporates the Keltner Channels and the Exponential Moving Average (EMA) to enable dynamic market analysis.

Visualisation
By visually assessing market conditions concerning the Keltner Channels and the EMA, the (KC-MACD) strategy provides valuable insights into potential buying and selling opportunities. It's important to note that while we explore new ideas, we should also remain mindful of well-established concepts that have proven their effectiveness over time. Balancing innovation with tried-and-true strategies can contribute to our overall success in the markets.

Let me explain - Keltner Channels and EMA
These two components form the foundation of the strategy. Keltner Channels create bands around the price chart that adapt to market volatility, similar to the (MACD-v) acting as boundaries for price movement. The (EMA), on the other hand, smooths out price data and serves as an indicator of the underlying trend.

Spotting Opportunities
If you are a visual person such as Peter, charting this strategy allows you to pay close attention when the closing price falls within the Keltner Channels but remains below the EMA. This scenario indicates a potential buying opportunity, as it suggests a favourable combination of market volatility and price movement.

In summary
This type of strategy simplifies the trading process by providing clear answers to key questions - what to buy and when to buy or sell. Traders can rely on the visual cues offered by the Keltner Channels and the MACD signals to guide their trading decisions effectively, well that's what I do.

Skate.
 
Spotting Opportunities
If you are a visual person such as Peter, charting this strategy allows you to pay close attention when the closing price falls within the Keltner Channels but remains below the EMA. This scenario indicates a potential buying opportunity, as it suggests a favourable combination of market volatility and price movement.

Keltner channels like the Boll bands show the current volatility and when volatility falls the bands squeeze together creating a very good risk reward setup. There's books and books discussing this volatility contraction pattern (VCP).

Bollinger band squeeze pattern,
John Carter squeeze pattern,
Mark MInervini VCP prior to a break-out. . .

Well worth your time researching this pattern and making an essential part of your trading arsenal. Can work in all markets and timeframes. (Note: extra work required to apply this profitably in FX markets. Needs to be considered only at support/resistance levels. )
 
Top