- Joined
- 28 December 2013
- Posts
- 6,392
- Reactions
- 24,319
Understanding TradingView Charts
In trading, our primary concern is knowing "what to buy" and "when to sell". Determining the number of shares to purchase can be done through a straightforward formula - simply divide your investment amount by the share price. For instance, if you have $100 to invest and the share price is $10, the calculation would be as simple as $100/10, resulting in 10 shares.
Important Metrics
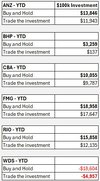
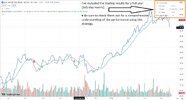
I’ve included the trading results for a full year (365-day metric) attached to the right-hand top corner of each chart. Be sure to check them out for a comprehensive understanding of the performance of each company.
# 1. ANZ
# 2. BHP
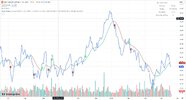
# 3. CBA
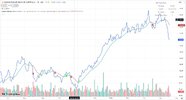
# 4. FMG
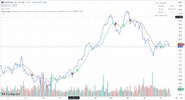
# 5. WDS
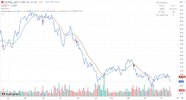
As a casual reminder
Did I mention that all of this comes at no cost whatsoever? Yes, it’s all “free”!
Skate.
In trading, our primary concern is knowing "what to buy" and "when to sell". Determining the number of shares to purchase can be done through a straightforward formula - simply divide your investment amount by the share price. For instance, if you have $100 to invest and the share price is $10, the calculation would be as simple as $100/10, resulting in 10 shares.
Important Metrics
I’ve included the trading results for a full year (365-day metric) attached to the right-hand top corner of each chart. Be sure to check them out for a comprehensive understanding of the performance of each company.
# 1. ANZ

# 2. BHP

# 3. CBA

# 4. FMG

# 5. WDS

As a casual reminder
Did I mention that all of this comes at no cost whatsoever? Yes, it’s all “free”!
Skate.

