Australian (ASX) Stock Market Forum

Dump it Here

@Skate...You are going to change your investment dividend tactics, from passive to active?

@Rabbithop, I’ve embarked on a personal mission to explore the potential of generating a sustainable passive income for retirees. This income is based on ‘dividends and franking credits’ from a carefully selected 5-position investment portfolio.

This commitment is not a fleeting one. I have dedicated a total of 8 more months to this endeavour. To make this journey more insightful and interactive, I’m sharing the live results every week. This allows others to follow along, learn from the process, and perhaps apply these insights to their financial strategies. It’s an exciting journey, but can this process be improved? which is what I'm trying to answer at the moment.

Skate.
 
I want to talk about why people act the way they do to help you understand how people think, how they react to you, how they make decisions and how you can handle them more effectively.

Decoding Unkind Behaviour
Encounters with unkind behaviour are not uncommon in this forum. Rude comments and dismissive gestures can often have an impact. However, it’s crucial to understand that such behaviour usually mirrors the individual’s struggles. Instead of reacting negatively or taking their behaviour personally, we can extend politeness in the way we respond. This approach fosters a more positive and supportive environment for everyone involved.

So, the next time you encounter unkindness
Take a step back, don't react but rather respond, responding gives you time to gather your thoughts. By responding politely, we can contribute where everyone feels valued and respected. So, the next time someone is unkind to you, view it as an opportunity to extend kindness and understanding, rather than reacting negatively. It's important to be respectful, even when we disagree with others.

Skate.
 
Conflict can be a learning experience
Conflicts reveal the true nature of the people we interact with an insight into the character and values of the individuals involved.

By paying close attention
We can gain a better understanding of their communication style and their emotional intelligence. We can also see how they react to stress and pressure in handling difficult situations. By examining our behaviour, we can identify areas where we need to improve and work on.

Skate.
 
The Motley Fool (extract)
ASX dividend shares are quite possibly the best source of passive income for all Australians. Investing in ASX divided shares for passive income is something we can all do today. The only downside with this stream is that it does require a 'substantial investment' of cash to get the ball rolling.

Dividend shares can give us everything we need as a source of passive income
No active labour is required, inflation-resistance, and income should rise over time. Like any ASX share investment, one needs to be judicious in selecting which ASX dividend shares will make the cut for a passive income portfolio.

Link to the article


Skate.
 
Harnessing the Power of the (MACD) Indicator
With system trading, all you need is a reliable indicator that everyone can grasp. The Moving Average Convergence Divergence (MACD) is one such tool that fits the bill perfectly. It simplifies the process by precisely handling both entry and exit points. This approach not only enhances the efficiency of trading but also makes it accessible to everyone, regardless of their level of experience.

The (MACD) is a versatile indicator
Why? Because it simplifies the trading process by precisely identifying both entry and exit points. By using a combination of moving averages, the (MACD) indicator generates buy and sell signals, making it easy for traders to enter and exit positions.

In conclusion
The (MACD) indicator is a powerful tool that simplifies the trading process and makes it accessible to traders of all skill levels. By using the (MACD) indicator, traders can quickly identify potential trading opportunities and make informed decisions. With its ease of use and reliability, the (MACD) indicator is an essential tool for any trader looking to enhance their trading experience.

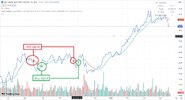
Removing false signal
It's still a work in progress but utilising Amibroker's (abs) function has eliminated these false signals to a degree.

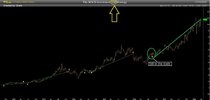
(PME) Using the original code
Those short-term trades can be referred to as "false signals"

PME - 9th April Signal.jpg


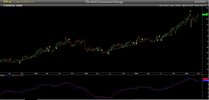
(PME) "The MACD Investment ABS Strategy" utilising Amibroker's (abs) function
The generated signals are an improvement, but not good enough at this stage.

PME.jpg

Skate.
 
What is it with Fridays? The week gives us gains and Fridays take some away. It's been happening for a while now. Anyway, it is what it is.
#1. Logo.jpg
My investment strategy is currently yielding positive results this week, but @peter2's insights have sparked a sense of anticipation in me regarding the market's performance tomorrow.

It's important to "keep in mind" that no one can predict with certainty what will happen tomorrow - even the most experienced can't always accurately predict market fluctuations.

Skate.
 
The quest for knowledge is infinite
Every answer we uncover leads to new questions, creating a never-ending cycle of learning and discovery that deepens our understanding of ourselves and the world around us.

Skate.
 
#1. Logo.jpg
A Real-life Investment Strategy
The objective of this 12-month real live experiment is to explore the feasibility of deriving a sustainable income from a portfolio of five investments, based on three key principles: (1) Dividends, (2) Franking Credits, and long-term (3) Capital Gains.

@peter2 posed a question - 'What's the deal with Fridays?'
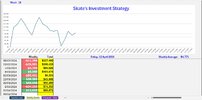
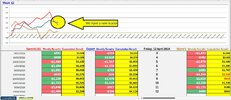
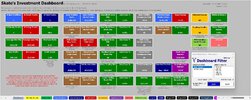
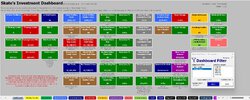
Today, Friday the 12th of April 2024, marked a substantial financial downturn. A staggering 50% of the weekly open profits dissipated from my Investment Strategy today.

After 18 weeks of this experiment
# Strategy Progress = $159,986
# Dividends and Franking credits = $74,115
# Capital Gains = $85,871
# Weekly Average = $4,771

2. Dashboard.jpg


3. Weekly Result Week 12.jpg


Skate.
 
1. Logo.jpg

New UPDATE.jpg
We have a new leader

# Disclaimer - This is a theoretical investment exercise

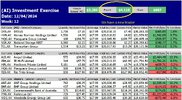
In this exercise, we put "Google (AI) Gemini" head-to-head with seasoned fund manager Dr. Don Hamson from Plato Investment Management. Both were tasked with providing their "top five growth and income stocks" for the next 12 months on the ASX.

First Place - $4,118
# Dr. Don Hamson (Expert) - BLUE line on the equity chart

Second Place - $3,280
# Google Gemini (AI) - RED line on the equity chart

Third Place - $667
# Skate - BROWN line on the equity chart

2. SummaryResult.jpg


3. WeeklyUpdate.jpg

Skate.
 
Trading PANDA eBook Generated Cover.jpg

The Trading PANDA: An Essential eBook for Beginners
For those intrigued by the world of trading, this eBook is tailored just for you. It’s specifically designed for individuals who are taking their first steps towards "financial independence" and are eager to learn about trading. This eBook provides insights into the basics of trading, helping you navigate your path towards financial freedom. The download link for the eBook is provided below.


Skate.
 
Last edited:
View attachment 174725

View attachment 174729
We have a new leader

# Disclaimer - This is a theoretical investment exercise

In this exercise, we put "Google (AI) Gemini" head-to-head with seasoned fund manager Dr. Don Hamson from Plato Investment Management. Both were tasked with providing their "top five growth and income stocks" for the next 12 months on the ASX.

First Place - $4,118
# Dr. Don Hamson (Expert) - BLUE line on the equity chart

Second Place - $3,280
# Google Gemini (AI) - RED line on the equity chart

Third Place - $667
# Skate - BROWN line on the equity chart

View attachment 174726


View attachment 174727

Skate.
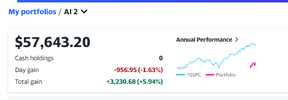
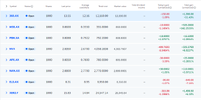
This is 5 weeks in, and one lot of AI picks have gone into negative territory with total value.


1712973518297.png
1712973570389.png

1712973644289.png
1712973676640.png
 
Mastering Trading with the (MACD) Indicator
@Fiona96, every trader grapples with three fundamental questions:
  1. What to buy?
  2. When to buy?
  3. When to sell?
Navigating these questions can be simplified using a single, powerful indicator, the 'Moving Average Convergence Divergence' (MACD). While the act of buying may seem straightforward, determining the optimal time to sell often poses a significant challenge for traders. This is where the (MACD) truly shines, providing clear signals that can guide your selling decisions.

Deep Dive into MACD Trading
For those interested in exploring the MACD further, @DaveTrade has crafted an insightful post on trading with the MACD. I strongly encourage you not just to skim through it, but to study it in depth. The knowledge you’ll gain from this resource could prove invaluable in your trading journey. Remember, the key to successful trading lies in continuous learning and strategic application of the insights gained.


# Make the "search function" your best friend.
The search feature is at the menu bar's top right-hand corner.

How you make money trading
By doing the same thing over and over. The chart below displays the (MACD) in action. The buy and sell signals are displayed on the chart.

RIO.jpg

Skate.
 
Hello everyone, I hope everyone is doing well. Could you kindly let me know where you locate the ASX stocks that performed the best over the past quarter in terms of earnings? Is there a website where we can obtain this information? gathered in one location? Thanks in advance!
 
Hello everyone, I hope everyone is doing well. Could you kindly let me know where you locate the ASX stocks that performed the best over the past quarter in terms of earnings? Is there a website where we can obtain this information? gathered in one location? Thanks in advance!

1. Best-performing stocks on the ASX in 2024 (Updated weekly)


2. CommSec Stock Screener
For members of CommSec.

Skate.
 
Last edited:
A Comprehensive Guide to No-Cost Trading Setup
Recently, our forum has been buzzing with lively discussions, especially among new members who are unsure about how to kickstart their trading journey. The most important lesson to remember is this - ‘getting started is more important than getting it right'. Embrace the concept of “learning as you go”. Start by taking modest positions with funds that are truly disposable - in other words, money that you can genuinely "afford to lose".

I usually avoid four-letter words, but there’s one that I find particularly appealing - “FREE”.
Traditionally, I’ve been hesitant to delve into various charting programs, especially those available at no cost. However, there’s one notable exception to this rule - TradingView. This exceptional software offers a vast array of free scripts for users to explore and even tailor to their preferences. It serves as a reminder that sometimes, the most valuable things in life are indeed free.

This will unfold as a series of posts, designed to ensure that everyone can follow along at their own pace without feeling overwhelmed.

Skate.
 
For this exercise
To illustrate what I’m discussing, I’ll be using TradingView charts with buy and sell signals, which I will explain in detail.

Nothing fancy

I've mirrored the positions from my actual investment strategy (ANZ, BHP, CBA FMG, and WDS). To ensure a fair comparison, I used the first signal from the TradingView Strategy for each position at the beginning of this financial year (2023/2024) investing $100k in each of the 5 positions as part of a buy-and-hold investment strategy. The position size of $100k is easily scalable to $1k or $10k, depending on your comfort level.

Timing was not a factor in this exercise
Positions were taken at the opening price that $100k could buy. The trading strategy involved acting on the signals without hesitation at the opening price of the day.

ANZ.jpg

Skate.
 
Now, let’s look at the results
1. The buy-and-hold strategy resulted in a capital gain of $27,514, which is a 5.5% return. (Commission Costs - $450)

# Buy-and-hold

Buy and Hold Results.jpg


# Trading the investment
2. The Trading Investment Strategy yielded a capital gain of $34,557, translating to a 6.9% return. (Commission Costs - $2,610)

Trading the investments Results.jpg

In conclusion
Trading breakouts can be effective, though not always. However, they tend to perform well over the long term. Remember, the cost of entry is minimal - all you need is some stake money. If you end up losing all your money, don’t fret. After all, it was money you were "prepared to lose".

Skate.
 
For those who enjoy delving deeper
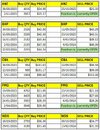
I’ll be sharing the charts (in the next post) for each position in the portfolio, along with the associated signals and corresponding data, including the investments and shares purchased during this exercise.

The parameters utilised in this exercise are as follows
1. Allocating an investment of $100k to each of the 5 positions, following a buy-and-hold investment strategy.
2. Investing $100k in each of the 5 positions, in line with the ‘Trade the Investment Strategy’ approach.

Investment Exercise Signals.jpg

Skate
 
Top