
- Joined
- 20 July 2021
- Posts
- 12,740
- Reactions
- 17,705
i am wired very differently to most , that post did confirm what i strongly suspectedI deleted my post for a simple reason - no one likes to read lengthy boring posts.
To shorten the post, I'll just display a summary of the strategy's performance in an easy-to-read format. The average profit per trade is relatively low because I'm looking to minimise the risk with this strategy. As I get older risk becomes the most important aspect of my trading.
Trend Momentum Strategy - $100k Portfolio
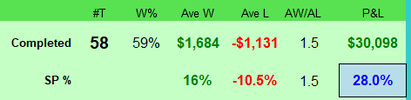
Total profit: $28,436.75
58 trades
Average profit per trade: $490.29
Winning percentage: 58%
Win/loss ratio: 1.41 (58 wins, 41 losses)
System Drawdown -3.73%
Maximum drawdown: -$4,751.89
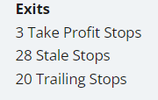
Exits
3 Take Profit Stops
28 Stale Stops
20 Trailing Stops
Skate.

Thanks Monsieur @Skate .@qldfrog I firmly adhere to my established routine and refrain from making any moves mid-week. Through extensive experimentation with various scenarios, I've found that deviating from this approach only scratches the surface. Consistently adhering to my trading rules and strategy has proven to be highly advantageous for my overall trading performance so far.
Skate.


Market gyrations can kill a good strategy
Are you tired of using the same old trading strategy that doesn't adapt to changing market conditions? I know I was. That's why I created a dynamic trading methodology that combines three different trend-following strategies, each with its own set of parameters and filters. This approach allows the strategy to adapt to different market conditions, but I didn't stop there.
I wanted to take this idea even further. What if we could create a trading strategy that can switch between different parameters, settings, and functions based on market sentiment? This would allow a strategy to adapt to changing market conditions in real-time.
The benefits of this approach are twofold. First, it allows the strategy to adapt to changing market conditions without having to manually adjust the strategy. Second, it tries to maximise trading potential by using the most appropriate indicators and parameters for the current market conditions.
In summary, switching parameters, settings, and functions can be a powerful way to adapt to changing market conditions. Combining this approach can create a trading strategy that is both flexible and effective.
Skate.


If the GTFO exit wasn't applied then the rest of my questions are irrelevant.
So obviously the word that requires understanding is: sentiment.
Second question: What is the time lag in switching between these different variables. Seconds, minutes, hours, days?
I thought your trend following system's estimation of "sentiment" was your "percentage up" parameter.
ie. The number of stocks within your trading universe (XAO) that closed up for the week.
Edit: More than 50% of the profit this year was made in small priced (risky) companies. eg MAY, LIN, LPI, IVZ.
The system did profit from short term rallies in LAU, MYR and the uranium trio PDN, BOE, DYL.
The system does earn its profit from short term price rallies throughout the XAO but earns more from the lower price companies as it's designed to do.
Three Points to Ponder for Improved Trading Performance
1. Mastering your trades is key to unlocking consistent profits. Focus on refining your strategies to maximise your potential for success.
2. Keep track of your trading strategies and stick to what works. Analyse your performance and adjust your approach accordingly.
3. Trust your system, but not blindly. If it's not yielding the desired results, it may be time to reassess and make changes.
Two Points to Ponder for Improved Trading Performance
6. Manage risk wisely, particularly when you're new to trading. A solid risk management plan can help to control your emotions.
7. Embrace calculated risk-taking to unlock potential gains. While it's important to be comfortable, caution limits your profit potential.
As I get older risk becomes the most important aspect of my trading.
I'll do a self-evaluation of the "Trend Momentum Strategy" as you have shown some interest.
The initial evaluation adopts a metric-driven methodology
I wanted to start a thread on people's Daily Habits/Routines when it comes to their Technical Analysis.
What are some must do habits or routines you've formed? Whether it be daily, weekly or even yearly.
On Fridays, I send an e-mail summary to those who have an interest in the performance of their funds under my control.

Your" Profit Trades Strategy " should be thrown overboardThe "Trend Momentum Strategy" self-evaluation
As I delve into the continuous assessment of the "Trend Momentum Strategy," I've identified two effective approaches that have proven valuable for gauging the strategy's ongoing performance.
The initial evaluation adopts a metric-driven methodology, where I succinctly record key observations (outlined below) and organise the findings under pertinent headings. While the format remains straightforward, it ensures consistency across my reports. This structured approach allows for a comprehensive and systematic analysis of the strategy's evolving dynamics.
Overall Performance
The net profit of $28,436.75 represents a 28.44% return on the initial capital, which is a strong performance. An annual return of 30.93% is impressive, and a risk-adjusted return of 63.68% suggests that the strategy managed risk effectively to achieve these returns.
Winners vs. Losers
The strategy had more winners than losers, with 58.62% of trades being profitable. The average profit per winning trade was 15.74%, which is a healthy margin.
Drawdowns
The maximum trade drawdown and system drawdown are within reasonable limits, and the recovery factor of 5.98 indicates the strategy’s resilience in recovering from losses.
Other Metrics
A profit factor of 2.13 is very good, showing that profits are more than double the losses. The Sharpe Ratio of 0.82 is decent, indicating that the excess return per unit of risk is satisfactory.
Trade Type Analysis
The strategy seems to have used a mix of trade exit strategies effectively, with Profit Take Trades locking in gains and Stale Stop Trades capturing larger profits.
Expectancy and Standard Deviation
An expectancy of $490.29 per trade is a strong indicator of the strategy’s profitability. The standard deviation of closed trades suggests there is some variability in trade returns, which is to be expected in trading.
Personal notes
The strategy has demonstrated a good balance between risk and return, with effective risk management and solid performance. Ongoing monitoring and adjustments are essential to maintain and improve performance in changing market conditions.
Skate.

Not enough PROLONGED GREEN in the Ribbon Chart for my liking@peter2 Chart below is the Perfect Example
Charts tell a story, one that unfolds in the past. We've all been guilty of gazing at a chart and thinking, "If only I had entered here and here." For me, that's exactly what I did, and finding that elusive correlation became an all-consuming quest.
Peters chart
The yellow arrow displays "the start of a trend".
View attachment 166935
The Percentage Up Filter is a powerful tool that works in real-time
In my chart, I've highlighted the correlation between the market and my trading strategy using yellow arrows. As you can see, the chart is heavily marked, indicating that the strategy and market are closely aligned. This means that by only entering positions when the lower ribbon is green, there is a significant chance of success.
View attachment 166936
Skate.
We use cookies and similar technologies for the following purposes:
Do you accept cookies and these technologies?
We use cookies and similar technologies for the following purposes:
Do you accept cookies and these technologies?