Australian (ASX) Stock Market Forum

Dump it Here

I deleted my post for a simple reason - no one likes to read lengthy boring posts.

To shorten the post, I'll just display a summary of the strategy's performance in an easy-to-read format. The average profit per trade is relatively low because I'm looking to minimise the risk with this strategy. As I get older risk becomes the most important aspect of my trading.

Trend Momentum Strategy - $100k Portfolio
Total profit: $28,436.75
58 trades
Average profit per trade: $490.29
Winning percentage: 58%
Win/loss ratio: 1.41 (58 wins, 41 losses)
System Drawdown -3.73%
Maximum drawdown: -$4,751.89

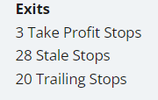
Exits
3 Take Profit Stops
28 Stale Stops
20 Trailing Stops

Skate.
i am wired very differently to most , that post did confirm what i strongly suspected

cheers and good luck
 
@qldfrog I firmly adhere to my established routine and refrain from making any moves mid-week. Through extensive experimentation with various scenarios, I've found that deviating from this approach only scratches the surface. Consistently adhering to my trading rules and strategy has proven to be highly advantageous for my overall trading performance so far.

Skate.
Thanks Monsieur @Skate .
 
Thank you for the detailed post (since deleted). I had it open and copied all the trades into one of my spreadsheets to study at a later date. Was surprised to see it gone when I went to reply. (ASF error shown).

(i) The initial outlay totaled $10,740 more than the $100K mentioned. (I allocated $20/trade for brokerage). Minor point.

(ii) I noticed that there was no compounding included when reinvesting capital. Minor point. Some soldiers on R&R.

(iii) This surprised me,

EXITS.PNG as it looked like the system used its GTFO exit on these dates (17/2, 19/5, 18/8, 6/10).

If the GTFO exit wasn't applied then the rest of my questions are irrelevant.

I assume that after a stale exit is triggered, a new trend momentum entry is required before starting another trade in the same stock.

skate2.PNG (any differences due to brokerage costs)

Posted this to show AW and AL which are more important than Ave result.

---------------

Edit: More than 50% of the profit this year was made in small priced (risky) companies. eg MAY, LIN, LPI, IVZ.
The system did profit from short term rallies in LAU, MYR and the uranium trio PDN, BOE, DYL.

The system does earn its profit from short term price rallies throughout the XAO but earns more from the lower price companies as it's designed to do.
 
Last edited:
Market gyrations can kill a good strategy
Are you tired of using the same old trading strategy that doesn't adapt to changing market conditions? I know I was. That's why I created a dynamic trading methodology that combines three different trend-following strategies, each with its own set of parameters and filters. This approach allows the strategy to adapt to different market conditions, but I didn't stop there.

I wanted to take this idea even further. What if we could create a trading strategy that can switch between different parameters, settings, and functions based on market sentiment? This would allow a strategy to adapt to changing market conditions in real-time.

The benefits of this approach are twofold. First, it allows the strategy to adapt to changing market conditions without having to manually adjust the strategy. Second, it tries to maximise trading potential by using the most appropriate indicators and parameters for the current market conditions.

In summary, switching parameters, settings, and functions can be a powerful way to adapt to changing market conditions. Combining this approach can create a trading strategy that is both flexible and effective.

Skate.

So obviously the word that requires understanding is: sentiment.

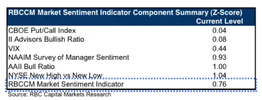
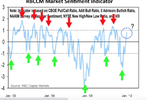
Are you actually talking about sentiment, something along these lines:

Screen Shot 2023-12-09 at 6.20.29 PM.pngScreen Shot 2023-12-09 at 6.20.51 PM.png

Or are you talking about something else?

Second question:

What is the time lag in switching between these different variables. Seconds, minutes, hours, days?

jog on
duc
 
If the GTFO exit wasn't applied then the rest of my questions are irrelevant.

@peter2 as part of my "StaleSell" exit strategy incorporates a "TimeSellFilter" that is directly linked to the buy condition averaged over a defined nPeriod. As well as the "TimeSellFilter" there is also a suite of filters including a GTFO filter you have referenced.

Having a range of filters in the exit strategy always raises concerns with some members about (complexity) but each filter is independent of each other "but" calls on the same parameter source.

UPDATE
For simplicity, the date references for the signals are for the end of the week. For example, the date heading "17/2/202" refers to the week starting on the 13th of February, 2023.

Skate.
 
So obviously the word that requires understanding is: sentiment.

@ducati916, in answering your questions I had to use a mental gymnastics approach to give enough information for the "non-coder" to understand while giving enough information for those searching for new trading ideas.

In terms of sentiment
I'm referring to a series of references like the Rate of Change and EMA compared over two defined periods. (See - Default Branch of Parameters below) Analysing these behaviours adjusts the strategy accordingly through statements.

A short explanation (Statements)
AmiBroker's AFL statements are used to define the logic and rules of a trading strategy, and they are similar to "statements" found in most other programming languages.

Some common AFL statements are (IF, AND, OR, ELSE, and THEN) statements
1. The IF statement is used to execute a block of code if a certain condition is met.

2. The AND statement is used to combine multiple conditions. If both conditions are true, then it will execute the code inside the THEN block.

3. The OR statement is used to specify alternative conditions. If either condition is true, then it will execute the code inside the THEN block.

4. The ELSE statement is used to specify code to execute when the IF condition is not met. If it's not, then it will execute the code inside the ELSE block.

5. The Case statement is used to specify multiple branches of code to execute based on a single condition. If none of the conditions are met, then it will execute the code inside the default branch. (see below)

These are just a few switching examples and there are many more, including loops, functions, and data manipulation statements, that can be used to create more complex and powerful trading strategies, that are well beyond this thread.

Another aspect to consider is "volatility"
I use a series of indicators to determine the volatility and when combined with the sentiment filter it also has an input to adjust the parameters and settings.

Default Branch of Parameters
1. ATRPeriods - The number of periods to use for the Average True Range (ATR) indicator.
2. SupportPeriods - The number of periods to use for the Support Level indicator
3. EMA1Periods - The number of periods to use for the first Exponential Moving Average (EMA1) indicator.
4. EMA2Periods - The number of periods to use for the second Exponential Moving Average (EMA2) indicator.

Second question: What is the time lag in switching between these different variables. Seconds, minutes, hours, days?

Regarding the time lag
The strategy calculations are updated with every "new data update", but the parameters and settings (update) after the end of trade on a Friday. What happens during the week is irrelevant when trading a "weekly strategy".

To clarify, the strategy recalculates and adjusts the parameters and settings based on every data update, but the end of the week (Friday) is the only one that counts. The time lag, or end-of-week data lag, refers to the fact that the strategy relies on end-of-week data to adjust its parameters and settings.

Skate.
 
Wow, was that the "easily understandable" reply?

I thought your trend following system's estimation of "sentiment" was your "percentage up" parameter.
ie. The number of stocks within your trading universe (XAO) that closed up for the week.

BTW I love this indicator. It's responds quickly and without the lag included in most index filters that use a moving average.
 
I thought your trend following system's estimation of "sentiment" was your "percentage up" parameter.
ie. The number of stocks within your trading universe (XAO) that closed up for the week.

@peter2 even though my trading strategy is complex it needs an overriding "BuyFilter" to decide when buy signal can be generated. Overall, this "BuyFilter" is used to calculate the percentage of up stocks in a watchlist and set an indicator based on whether the percentage is bullish or not. Simply it means when the "BuyFilter" is true buy signals can be generated.

The "Percentage Up" Filter is a "Timing Filter"
It's important to note that the strategy's effectiveness is somewhat constrained by my coding proficiency. Nevertheless, when the stars align, and the "Percentage Up" Filter validates a favorable condition, the strategy is poised to perform.

In a more technical context
The integration of the "Percentage Up" filter necessitates its inclusion within a loop function. Following the completion of this loop, the derived values representing the percentage of stocks that closed higher than their open price are preserved using the StaticVarSet function, ensuring their persistence across iterations.

Subsequently, retrieval of these values is facilitated through the StaticVarGet function, enabling the recalibration of the percentage based on the stored data. This meticulous process ensures the accurate and efficient calculation of the percentage of stocks that exhibit an upward closing trend compared to their open price within the given dataset.

Skate.
 
Seven Points to Ponder for Improved Trading Performance

1. Mastering your trades is key to unlocking consistent profits. Focus on refining your strategies to maximise your potential for success.

2. Keep track of your trading strategies and stick to what works. Analyse your performance and adjust your approach accordingly.

3. Trust your system, but not blindly. If it's not yielding the desired results, it may be time to reassess and make changes.

4. No trader is right all the time. Try to win more than you lose and you'll be able to grow your account over time.

5. Simplicity when starting out is often the key to successful trading, refinement comes later.

6. Manage risk wisely, particularly when you're new to trading. A solid risk management plan can help to control your emotions.

7. Embrace calculated risk-taking to unlock potential gains. While it's important to be comfortable, caution limits your profit potential.

Skate.
 
Edit: More than 50% of the profit this year was made in small priced (risky) companies. eg MAY, LIN, LPI, IVZ.
The system did profit from short term rallies in LAU, MYR and the uranium trio PDN, BOE, DYL.

The system does earn its profit from short term price rallies throughout the XAO but earns more from the lower price companies as it's designed to do.

@peter2, thank you for your evaluation as it inspires me to explain the importance of ongoing strategy evaluation even when you believe trading is firing on all cylinders. After I make a few comments, I'll do a self-evaluation of the "Trend Momentum Strategy" as you have shown some interest.

Skate.
 
Three Points to Ponder for Improved Trading Performance
1. Mastering your trades is key to unlocking consistent profits. Focus on refining your strategies to maximise your potential for success.
2. Keep track of your trading strategies and stick to what works. Analyse your performance and adjust your approach accordingly.
3. Trust your system, but not blindly. If it's not yielding the desired results, it may be time to reassess and make changes.

Strategy Evaluation is embedded in the three points above
To enhance trading effectiveness, traders must comprehensively understand the data they analyse, including their analysis methods underlying assumptions and limitations. This awareness is pivotal in averting pitfalls like overfitting or selectively choosing data to confirm preconceived notions, which can lead to inaccurate or biased conclusions.

Skate.
 
Two Points to Ponder for Improved Trading Performance
6. Manage risk wisely, particularly when you're new to trading. A solid risk management plan can help to control your emotions.
7. Embrace calculated risk-taking to unlock potential gains. While it's important to be comfortable, caution limits your profit potential.

A paramount aspect of successful trading lies in robust risk management
Traders must establish explicit risk management rules and steadfastly adhere to them. The journey to successful trading necessitates continuously refining each trading strategy through meticulous analysis. Remaining attuned to evolving market conditions, harnessing the latest technologies and tools, and adhering to a disciplined approach empower traders to generate consistent profits over time.

Skate.
 
As I get older risk becomes the most important aspect of my trading.

Emphasising the significance of drawdown
It's imperative not to settle for high drawdown levels, as they imply an increased risk of substantial financial losses. Traders can mitigate these risks by considering various metrics when assessing a strategy's performance. It is crucial to exercise caution when relying solely on backtesting results and to be prepared to adapt strategies as market conditions evolve.

Skate.
 
I'll do a self-evaluation of the "Trend Momentum Strategy" as you have shown some interest.

The "Trend Momentum Strategy" self-evaluation
As I delve into the continuous assessment of the "Trend Momentum Strategy," I've identified two effective approaches that have proven valuable for gauging the strategy's ongoing performance.

The initial evaluation adopts a metric-driven methodology, where I succinctly record key observations (outlined below) and organise the findings under pertinent headings. While the format remains straightforward, it ensures consistency across my reports. This structured approach allows for a comprehensive and systematic analysis of the strategy's evolving dynamics.

Overall Performance
The net profit of $28,436.75 represents a 28.44% return on the initial capital, which is a strong performance. An annual return of 30.93% is impressive, and a risk-adjusted return of 63.68% suggests that the strategy managed risk effectively to achieve these returns.

Winners vs. Losers
The strategy had more winners than losers, with 58.62% of trades being profitable. The average profit per winning trade was 15.74%, which is a healthy margin.

Drawdowns
The maximum trade drawdown and system drawdown are within reasonable limits, and the recovery factor of 5.98 indicates the strategy’s resilience in recovering from losses.

Other Metrics
A profit factor of 2.13 is very good, showing that profits are more than double the losses. The Sharpe Ratio of 0.82 is decent, indicating that the excess return per unit of risk is satisfactory.

Trade Type Analysis
The strategy seems to have used a mix of trade exit strategies effectively, with Profit Take Trades locking in gains and Stale Stop Trades capturing larger profits.

Expectancy and Standard Deviation
An expectancy of $490.29 per trade is a strong indicator of the strategy’s profitability. The standard deviation of closed trades suggests there is some variability in trade returns, which is to be expected in trading.

Personal notes
The strategy has demonstrated a good balance between risk and return, with effective risk management and solid performance. Ongoing monitoring and adjustments are essential to maintain and improve performance in changing market conditions.

Skate.
 
Last edited:
The initial evaluation adopts a metric-driven methodology

Trading Strategy Evaluation - Metric Driven Overview
The second evaluation (report) is more metric-driven for further evaluation and comparisons. Journaling improves your trading, that I can guarantee.

# 1. Overall Performance
Net Profit: $28,436.75 (28.44% return)
Annual Return: 30.93%
Risk-Adjusted Return: 63.68%

Explanation Notes
The strategy started with $100,000 or so grew to $128,436.75, resulting in a net profit of $28,436.75. Achieving an annual return of 30.93%, showcasing effective risk management for a solid risk-adjusted return of 63.68%.

# 2. Winners vs. Losers
Winning Trades: 58.62%
Average Profit per Winning Trade: 15.74%

Explanation Notes
The strategy displayed a favourable ratio of winning trades at 58.62%, and each winning trade generated an average profit of 15.74%.

# 3. Drawdowns
Max Trade Drawdown: -$2,215.8
Max System Drawdown: -$4,751.89
Recovery Factor: 5.98

Explanation Notes
The strategy displayed a favourable ratio of winning trades at 58.62%, and each winning trade generated an average profit of 15.74%.The maximum drawdown in a single trade was -$2,215.8, representing a 22.12% decline. The overall system experienced a maximum drawdown of -$4,751.89, showcasing a robust recovery factor of 5.98.

# 4. Other Metrics
Profit Factor: 2.13
Sharpe Ratio of Trades: 0.82

Explanation Notes
The strategy displayed a favourable ratio of winning trades at 58.62%, and each winning trade generated an average profit of 15.74%.The maximum drawdown in a single trade was -$2,215.8, representing a 22.12% decline. The overall system experienced a maximum drawdown of -$4,751.89, showcasing a robust recovery factor of 5.98. The profit factor of 2.13 indicates that the strategy's total profits were more than twice the total losses. A Sharpe Ratio of 0.82 reflects a reasonable risk-adjusted return.

# 5. Trade Type Analysis
Profit Take Trades: 3 with an average profit of $230.56 (2.31%)
Stale Stop Trades: 28 with an average profit of $456.67 (4.56%)

Explanation Notes
The strategy displayed a favourable ratio of winning trades at 58.62%, and each winning trade generated an average profit of 15.74%.The maximum drawdown in a single trade was -$2,215.8, representing a 22.12% decline. The overall system experienced a maximum drawdown of -$4,751.89, showcasing a robust recovery factor of 5.98. The profit factor of 2.13 indicates that the strategy's total profits were more than twice the total losses. A Sharpe Ratio of 0.82 reflects a reasonable risk-adjusted return. The strategy effectively employed different trade exit strategies, with Profit Take Trades securing smaller, consistent gains and Stale Stop Trades capturing larger profits.

# 6. Expectancy and Standard Deviation
Expectancy ($): $490.29

Explanation Notes
The strategy displayed a favourable ratio of winning trades at 58.62%, and each winning trade generated an average profit of 15.74%. The maximum drawdown in a single trade was -$2,215.8, representing a 22.12% decline. The overall system experienced a maximum drawdown of -$4,751.89, showcasing a robust recovery factor of 5.98. The profit factor of 2.13 indicates that the strategy's total profits were more than twice the total losses. A Sharpe Ratio of 0.82 reflects a reasonable risk-adjusted return. The strategy effectively employed different trade exit strategies, with Profit Take Trades securing smaller, consistent gains and Stale Stop Trades capturing larger profits. The expectation of $490.29 per trade indicates a strong average profit per trade, demonstrating the strategy's profitability. The standard deviation of closed trades suggests some variability in trade returns.

Personal Notes
The comprehensive evaluation of the trading strategy reveals a well-performing portfolio with strengths in profitability, risk management, and effective use of trade exit strategies. The strategy has shown resilience in recovering from losses and has a favourable balance between risk and return. However, ongoing monitoring and adjustments are essential, don't rest on your laurels just yet.

Skate.
 
Last edited:
I wanted to start a thread on people's Daily Habits/Routines when it comes to their Technical Analysis.
What are some must do habits or routines you've formed? Whether it be daily, weekly or even yearly.

Do you ever wonder what other traders do all day?
In response to @MDWake, I shared some fundamental insights, offering a quick glimpse into my daily routine dedicated to enhancing my trading skills. Here's a brief rundown of how I invest my time in the pursuit of continuous improvement.

During trading hours
I occasionally check in on the proceedings throughout the day. However, I've learned that once I've taken a trade, my job is to sit tight and wait for a sell signal. It's important to resist the temptation to act on "gut feelings" that go against my trading strategy. Instead, I make a note of these feelings and review them later to see if they are accurate or not. This helps me refine my strategy and avoid making impulsive decisions.

At the end of each day
I complete a record of my trading activity. This helps me keep track of my progress and identify areas for improvement. On Fridays, I send a summary of my weekly records to those who have an interest in the performance of their funds under my control. This helps me stay accountable and ensures that I'm always striving to do better.

During the weekends
I conduct a comprehensive analysis of my trading systems to ensure they remain effective and efficient. Additionally, I allocate time to brainstorm new trading ideas and strategies, as I believe that continuous learning and adaptation are crucial for success in the financial markets.

Furthermore
I enjoy sharing my insights and experiences in the "Dump it here thread" to give back to the community and help others who may benefit from my knowledge. By following these habits and routines, I have been able to achieve a high level of success in trading, and I hope that my experiences can serve as a valuable resource for other traders.

In summary
My daily habits and routines are centred around staying informed, focused on my trading strategy, and continuously improving my skills. I believe that following these habits has been my recipe for success.

Skate.
 
On Fridays, I send an e-mail summary to those who have an interest in the performance of their funds under my control.

Embracing the Hustle Beyond Retirement
Being self-employed and choosing to work seven days a week with only five days off annually was a path I willingly chose. Retirement painted a picture of leisure and respite in my mind, but reality had other plans. Far from slowing down, I find myself immersed in the world of trading, dedicating seven days a week and countless nights to mastering the art.

Pressure
Never underestimate the intense pressure you put yourself under when trading with money that belongs to others. Trading on behalf of others only requires minutes each week. However, the bulk of my time is consumed by meticulous reporting, strategy evaluations, and brainstorming sessions that drive my trading endeavours. Sharing my experiences on the forum offers a momentary escape, connecting with members who understand the relentless drive that fuels us all.

Transparency when managing funds for others
Over time I've found supplying clear and precise weekly reporting is essential, as it allows others to see how their funds are being used and how they are performing. This helps to build trust and credibility, which is critical for maintaining positive relationships.

Accountability
This is also an important aspect of my reporting, as it ensures that I'm responsible for managing the funds. Weekly reporting provides a visual indication of their accumulated returns with a "weekly update" so they can evaluate the ongoing performance of their trusted funds.

Performance
Reporting helps to provide insights into the ongoing performance of their funds. This is particularly important as everyone is interested in how their investments are travelling and whether they are meeting their expectations.

Overall
To effectively manage family members funds, I've implemented a comprehensive reporting system that provides regular weekly updates on portfolio performance to ensure transparency, trust, and long-term relationships.

Skate.
 
The "Trend Momentum Strategy" self-evaluation
As I delve into the continuous assessment of the "Trend Momentum Strategy," I've identified two effective approaches that have proven valuable for gauging the strategy's ongoing performance.

The initial evaluation adopts a metric-driven methodology, where I succinctly record key observations (outlined below) and organise the findings under pertinent headings. While the format remains straightforward, it ensures consistency across my reports. This structured approach allows for a comprehensive and systematic analysis of the strategy's evolving dynamics.

Overall Performance
The net profit of $28,436.75 represents a 28.44% return on the initial capital, which is a strong performance. An annual return of 30.93% is impressive, and a risk-adjusted return of 63.68% suggests that the strategy managed risk effectively to achieve these returns.

Winners vs. Losers
The strategy had more winners than losers, with 58.62% of trades being profitable. The average profit per winning trade was 15.74%, which is a healthy margin.

Drawdowns
The maximum trade drawdown and system drawdown are within reasonable limits, and the recovery factor of 5.98 indicates the strategy’s resilience in recovering from losses.

Other Metrics
A profit factor of 2.13 is very good, showing that profits are more than double the losses. The Sharpe Ratio of 0.82 is decent, indicating that the excess return per unit of risk is satisfactory.

Trade Type Analysis
The strategy seems to have used a mix of trade exit strategies effectively, with Profit Take Trades locking in gains and Stale Stop Trades capturing larger profits.

Expectancy and Standard Deviation
An expectancy of $490.29 per trade is a strong indicator of the strategy’s profitability. The standard deviation of closed trades suggests there is some variability in trade returns, which is to be expected in trading.

Personal notes
The strategy has demonstrated a good balance between risk and return, with effective risk management and solid performance. Ongoing monitoring and adjustments are essential to maintain and improve performance in changing market conditions.

Skate.
Your" Profit Trades Strategy " should be thrown overboard
In My Humble Opinion IMHO
XYZ Yacht.GIF
 
@peter2 Chart below is the Perfect Example
Charts tell a story, one that unfolds in the past. We've all been guilty of gazing at a chart and thinking, "If only I had entered here and here." For me, that's exactly what I did, and finding that elusive correlation became an all-consuming quest.

Peters chart
The yellow arrow displays "the start of a trend".

View attachment 166935


The Percentage Up Filter is a powerful tool that works in real-time
In my chart, I've highlighted the correlation between the market and my trading strategy using yellow arrows. As you can see, the chart is heavily marked, indicating that the strategy and market are closely aligned. This means that by only entering positions when the lower ribbon is green, there is a significant chance of success.

View attachment 166936

Skate.
Not enough PROLONGED GREEN in the Ribbon Chart for my liking
I know you can do better!

XYZ Yacht.GIF
 
Top