Australian (ASX) Stock Market Forum

Dump it Here

System trading can be a great tool for traders, but keep in mind that it is not a failsafe method by any means. There is no trading method that can guarantee profits or protect against losses. However, utilising a system can assist bring structure and discipline to a trader's approach, increasing the likelihood of long-term success.

Discretionary trading is an alternative to system trading in which trades are made based on a trader's subjective judgement of the market. While discretionary trading provides flexibility and adaptability, it is also susceptible to emotions, biases, and other factors that can lead to poor decision-making.

System trading, on the other hand, relies on objective rules and algorithms to identify and execute trades. This can aid in the removal of emotional biases and the consistency of trading decisions.

Overall, while system trading may not always work, it can be a useful tool for traders who wish to approach the market with discipline and structure. Traders can boost their chances of long-term success by combining a well-developed method with effective risk management practices.

Skate.
 
Well Done Crew
We're off to a Good Start


z1489e00az50340d7e671b4f7ca35fc9ecae19a080.png
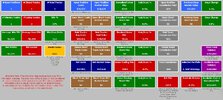
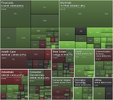
Chart data is real-time, as of 10 07 2023 10:12am AEST

HeatmapLegend.png
-2.5%
0.00%
2.5%
Colour is based on price performance

Salute And Gods' Speed

XYZ Yacht.GIF
 
The main advantage of technical analysis is that it allows traders to make data-driven decisions based on historical market data.

Technical Analysis reduces emotions
Technical analysis can help traders reduce emotions and make more rational trading decisions, which is particularly important during times of market volatility or after significant losses. System trading can help traders avoid impulsive or irrational decisions that could lead to further losses.

Most traders experience a range of feelings after a market breakdown that can turn into absolute chaos in a heartbeat. That feeling is comparable to the five phases of mourning described by Dr. Elisabeth Kubler-Ross in her book On Death and Dying: A Practical Guide.

1. Denial: When the market first exhibits symptoms of weakness, there is denial. Simply, traders don't consider the chance that the current situation might get worse.

2. Anger: Anger develops when the weakness continues. Traders may become angry with themselves for not acting sooner to stop the losses.

3. Bargaining: In the following stage, traders begin to strike agreements with themselves. If the position bounces back to breakeven, I'll sell.

4. Depression: As losses increase and the market keeps losing strength, depression may develop, believing there is little chance of getting their money back.

5. Acceptance: Traders can finally enter a state of acceptance as they come to terms with the truth of the circumstance by selling the position, accepting the loss, and moving on.

Traders can take action to control their emotions by being aware of the emotional stages they may experience during a market breakdown, acknowledging losses and mistakes, and moving to formulate a plan to improve their trading.

Skate.
 
An inventive but tenuous and strained analogy.
"Truth will not be organized and is a pathless land" by notme

200.gif
 
System trading can be a great tool for traders, but keep in mind that it is not a failsafe method by any means. There is no trading method that can guarantee profits or protect against losses. However, utilising a system can assist bring structure and discipline to a trader's approach, increasing the likelihood of long-term success.

Discretionary trading is an alternative to system trading in which trades are made based on a trader's subjective judgement of the market. While discretionary trading provides flexibility and adaptability, it is also susceptible to emotions, biases, and other factors that can lead to poor decision-making.

System trading, on the other hand, relies on objective rules and algorithms to identify and execute trades. This can aid in the removal of emotional biases and the consistency of trading decisions.

Overall, while system trading may not always work, it can be a useful tool for traders who wish to approach the market with discipline and structure. Traders can boost their chances of long-term success by combining a well-developed method with effective risk management practices.

Skate.
For the benefit of those new to trading I will add something to @Skate 's post;

There is another variation of discretionary trading that is more common than the completely discretionary type of trading that Skate has described, that is, where the market to trade is chosen in a discretionary way but the method used to make the trade is completely systematic.
This type of hybrid trading method is very common and for this reason a lot of the techniques that Skate is describing to you regarding his totally mechanical method also can be applied to many discretionary trading methods.
 
I often get asked, what is the best trend-following strategy?
It's difficult to say which trend trading method is more profitable, as the profitability of a trading method depends on a variety of factors, such as the market conditions, the trader's skill and experience, and their ability to manage risk. Different traders may find different methods more or less profitable, depending on their individual trading styles and preferences.

Ultimately, the most profitable trend trading method is the one that a trader is most comfortable and successful using. It's important to thoroughly test and evaluate any trading method before using it in real-world trading and to always manage risk carefully to avoid significant losses.

Skate.
 
I've been asked more than once - "why do you use a lot of indicators"?
There are several advantages to using multiple indicators in a trading strategy. One of the primary advantages is the ability to confirm signals, which can help limit the danger of false positives. When two or more indicators offer a buy or sell signal, confidence in buying or selling a position can increase.

Another advantage of employing multiple indicators is diversification. By incorporating many types of indicators, like momentum, and volatility indicators, traders can gain a more comprehensive view of the market and identify opportunities that may have gone unnoticed with a single indicator.

Combining multiple indicators can also increase signal accuracy, resulting in more accurate trading decisions. Many indicators can also be used to construct a risk management strategy. To identify probable stop-loss levels and decrease downside risk, a trader, for example, may use a combination of volatility and support and resistance indicators.

Using different indicators allows traders to adjust their approach to market analysis to their individual trading styles and risk tolerance. Traders can create their own unique trading strategy that aligns with their objectives by selecting and combining indicators that appeal to them.

If done correctly, trend trading is a popular and possibly rewarding method for any trader. The key to success is spotting market trends and entering trades in the trend's direction. Proper risk management is also important, and having a well-defined exit strategy will help you cut losses fast if a trade fails to perform.

While your approach to trend trading may differ from others, this doesn't necessarily imply that it is incorrect. A trading strategy's effectiveness is determined by a variety of elements, including the trader's coding skill, market conditions, and the precise approach adopted.

Skate.
 
Trading freedom
Indicators and filters are very similar to hidden treasures and the possibilities that you can discover using them is limitless and full of opportunities.

I was recently surprised to learn that many traders may not be aware of the wide range of filters and tools available to system traders. One example of such a filter is the Hann filter, which is particularly effective at smoothing out noisy data and identifying underlying trends in price movements. Despite its effectiveness, however, the Hann filter is not as well-known as some other technical indicators.

It's important to recognise that the Hann filter is just one of many tools that traders can use to analyse market data and that no single tool should be relied upon exclusively. Traders should always use multiple indicators and filters in conjunction with each other to gain a more complete understanding of market trends and make more informed trading decisions.

Finally, it's crucial to thoroughly test and validate any trading strategy using historical data before applying it in live trading. Doing so can help traders identify potential flaws or weaknesses in their strategies and make any necessary adjustments before risking real capital. By utilising a range of technical indicators, including the Hann filter, and conducting thorough testing of their strategies, traders can increase their chances of success in the exciting and dynamic world of trading.

Skate.
 
XAO.jpg

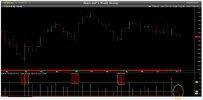
The "Percentage Up" filter
I appreciate you don't have to be "Einstein" to know when only 20% of the All Ordinaries index is advancing, eeking out a profit is difficult.

Overall, the "Percentage Up" filter is a useful tool that can provide valuable insights into market trends and conditions. If a high percentage of stocks have increased in value, it may suggest an uptrend, while a low percentage such as today indicates a downtrend.

However, it's essential to remember that no single filter or indicator can provide a complete picture of market conditions. Traders should always use multiple filters and technical indicators in conjunction with each other to gain a more comprehensive understanding of market trends to make informed trading decisions.

Skate.
 
For the benefit of those new to trading I will add something to @Skate 's post;

There is another variation of discretionary trading that is more common than the completely discretionary type of trading that Skate has described, that is, where the market to trade is chosen in a discretionary way but the method used to make the trade is completely systematic.
This type of hybrid trading method is very common and for this reason a lot of the techniques that Skate is describing to you regarding his totally mechanical method also can be applied to many discretionary trading methods.
Yes I think most futures traders do that. There's also a growing cohort of retail traders using machine learning, sentiment analysis and other forms of AI. GPT4 can do fundamental analysis at a high level, spitting out reports that would match those done by brokers, eg.

https://www.mlq.ai/gpt-4-financial-statements-ai-analyst/

I don't think technical sophistication necessarily correlates with performance though. It probably does correlate when the user is very high level. The Sam Altmans of the world are probably extracting large sums of money from the market as a matter of course.
 
An inventive but tenuous and strained analogy.
"Truth will not be organized and is a pathless land" by notme

@finicky, thanks for visiting and making a comment, even though the comments were lost on me.

Angel Smilie.jpg

A joke just for you
A young boy just got his driver’s licence and asked his dad if he could use the family car.

His dad said:
“I’ll make a deal with you. If you bring your grades up, study your Bible, and get your hair cut, we can talk about the car.”

The boy gladly agreed
After about six weeks, the young boy approached his dad to ask for the car again.

The dad replied:
“Son, I’m proud. You’ve brought your grades up, you’ve been studying your Bible. But, I’m really disappointed, that you haven’t had your hair cut.”

The young man paused a moment and then said:
“You know Dad, I’ve been thinking about that, and I’ve noticed in my studies of the Bible that Samson had long hair, John the Baptist had long hair, Moses had long hair and there’s even a strong argument that Jesus had long hair also.”

To this, his father replied:
“Did you also notice they all walked everywhere they went?”

Skate.
 
View attachment 159375

The "Percentage Up" filter
I appreciate you don't have to be "Einstein" to know when only 20% of the All Ordinaries index is advancing, eeking out a profit is difficult.

Overall, the "Percentage Up" filter is a useful tool that can provide valuable insights into market trends and conditions. If a high percentage of stocks have increased in value, it may suggest an uptrend, while a low percentage such as today indicates a downtrend.

However, it's essential to remember that no single filter or indicator can provide a complete picture of market conditions. Traders should always use multiple filters and technical indicators in conjunction with each other to gain a more comprehensive understanding of market trends to make informed trading decisions.

Skate.

An interesting chart + indicator. Not sure how exactly you use it but just on this:

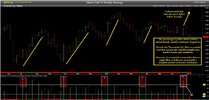
1. The 3 boxed signals are: (i) closing higher than the range of the preceding bar, (ii) signal the start of a move.

2. The last signal, unboxed, (iii) did not close higher than the range of the preceding bar. The signal (has to date) failed.

Screen Shot 2023-07-11 at 7.37.06 AM.png

I'm guessing your chart runs from about Oct. last year. With context, and I'm sure why you use additional indicators, the quality of the signal is materially different. In this case lower quality.

So the issue always is: given an analysis that runs 5,6,7 indicators, when they contradict one another, is there a hierarchy or scoring system that gives a green light or red?

You do allude to this in your post, but do not amplify. Curious as to the final arbiter. Discretionary or mechanical?

jog on
duc
 
An interesting chart + indicator. Not sure how exactly you use it but just on this:

1. The 3 boxed signals are: (i) closing higher than the range of the preceding bar, (ii) signal the start of a move.

2. The last signal, unboxed, (iii) did not close higher than the range of the preceding bar. The signal (has to date) failed.
I'm guessing your chart runs from about Oct. last year. With context, and I'm sure why you use additional indicators, the quality of the signal is materially different. In this case lower quality.

So the issue always is: given an analysis that runs 5,6,7 indicators, when they contradict one another, is there a hierarchy or scoring system that gives a green light or red?

You do allude to this in your post, but do not amplify. Curious as to the final arbiter. Discretionary or mechanical?

@ducati916 thank you for your keen observation. I'll answer your specific questions over a series of posts and then give an overall assessment in a separate post on how all the indicators and filters work together.

But first, I need to write my daily post, before answering your questions and responding to your comments.

Skate.
 
"Trading for Beginners - Skate's Practical Guide to Profitable Trading"
A daily series of posts aimed at those just starting out on their trading journey.

65. System trading in a nutshell
System trading, mechanical system trading, is a trading strategy that makes trading decisions based on a set of precisely defined rules.

System trading is simply rules-based trading. Every trading system has a set of rules, parameters, and filters that will determine the entry and exit points, as well as risk management and position sizing. System trading can remove the impact of emotions, which can be a big problem for new traders.

One of the primary benefits of system trading is that it produces trading decisions based on mathematical equations. Maths help identify trends and provide buy or sell signals. Mathematical equations can be utilised to plot moving averages, draw trendlines, and calculate technical indicators.

Another advantage of system trading is that it uses a systematic approach to risk management. System traders can lower the danger of losses by adopting rules for risk control and position sizing. This can assist traders in staying in the game for the long haul and potentially give them half a chance of achieving long-term trading success.

However, it is vital to understand that simply having a trading system in place does not ensure trading success. System traders must also exercise self-control and discipline, as well as sticking to their trading strategy in the face of market fluctuations or unforeseen situations. To be competitive in the markets, traders must be willing to modify, tweak, and finetune their strategy when market conditions change to enhance their trading method, keeping it current and fresh.

System trading is a common trading strategy that uses established rules and algorithms to make trading decisions. System traders can make informed trading decisions based on data by reducing emotional biases and subjectivity.

For traders, having a trading system in place has many advantages. By removing uncertainty, it enables traders to make informed decisions based on research and evidence.

While having a trading system in place is essential for success, traders must also exercise self-control and discipline in order to trade the signals without fear or favour. This entails remaining committed to the trading strategy and restraining from acting rashly or emotionally, regardless of market swings or unforeseen circumstances.

Skate.
 
The "Percentage Up" filter - Not sure how exactly you use it but just on this:

1. The 3 boxed signals are: (i) closing higher than the range of the preceding bar, (ii) signal the start of a move. 2. The last signal, unboxed, (iii) did not close higher than the range of the preceding bar. The signal (has to date) failed. 3. With context, and I'm sure why you use additional indicators, the quality of the signal is materially different. In this case lower quality.

XAO.jpg

1. The 3 boxed signals are: (i) closing higher than the range of the preceding bar, (ii) signal the start of a move.

@ducati916 the four previous boxed signals are significant because they indicate when a buy signal is possible. The first boxed signal, when the closing price is higher than the previous bar's range, is crucial because it indicates that the market has pushed beyond the previous range and may continue to trend upward. This is a bullish indication, and the SAP Strategy can enter a long position as a result.

The second, third, and fourth boxed signal, which indicates the commencement of a move, is also significant since it indicates that the market is about to move in a new direction.

The "Percentage Up" filter is basically a timing filter that turns buy signal "on or off" dependent on whether 50% of the XAO are advancing. This filter is designed to prevent the SAP strategy from generating buy signals during periods of market weakness or uncertainty, which can help to minimize risk and improve the overall performance of the strategy.

While the coding underlying the "Percentage Up" filter is complicated, its function is rather simple. The filter ensures that the SAP strategy only creates signals during moments of strength and momentum by turning on the "buy" signal based on market conditions, which can improve the strategy's accuracy and profitability.

2. The last signal, unboxed, (iii) did not close higher than the range of the preceding bar. The signal (has to date) failed.

The last boxed signal indicated that the "Percentage Up" filter once again did its job but unfortunately, market sentiment stepped in after the signal was generated. When a signal is generated after a period of consolidation or range-bound trading this can be a watershed moment, especially if it follows through strongly. But in this case, trader enthusiasm was short-lived.

3. With context, I'm sure why you use additional indicators, the quality of the signal is materially different. In this case lower quality.

Overall, the "Percentage Up" filter is a useful tool that can provide valuable insights into market trends and overall market conditions. However, it's essential to remember that no single filter or indicator can provide a complete picture of market conditions. In a nutshell, the "Percentage Up" indicator allows traders to enter a position early and perhaps profit from the coming trend, at times the pending trend fails to live up to expectations.

Skate.
 
(1) Curious as to the final arbiter. Discretionary or mechanical? (2) So the issue always is: given an analysis that runs 5,6,7 indicators, when they contradict one another, (3) Is there a hierarchy or scoring system that gives a green light or red?

(1) Curious as to the final arbiter. Discretionary or mechanical?

@ducati916 first off, the SAP Strategy is totally a 100% mechanical trend trading system, that involves no discretion in the decision-making process, and the signals given by the indicators and filters are strictly followed. In saying this the only discretionary input is physically making sure there are no announcements in the previous 3 months to ensure the company is not under a "takeover offer" or under a "deed of arrangement" (a court order) before the position is placed in the pre-auction.

(2) So the issue always is: given an analysis that runs 5,6,7 indicators, when they contradict one another

In the SAP strategy, the indicators are designed to build on top of each other rather than conflict or contradict each other. This is known as a top-down approach, where each indicator is used to filter out trades that are not in line with the buy criteria or overall market trend.

(3) Is there a hierarchy or scoring system that gives a green light or red?

The SAP strategy uses a combination of indicators and filters, including the Hann filter, volatility parameters, main market parameters, Ulcer Index Indicator, Elder Impulse Parameters, Percentage Mode Parameters, and the "Percentage Up" filter, to generate buy signals to minimise risk and maximise returns. This top-down approach ensures that the different indicators and filters work in harmony and complement each other, rather than conflicting.

The final decision to exit a trade is based on a different set of indicators and filters, that directly relates to the time of the entry. However, the strategy is designed to be used in a systematic manner, with no discretionary input other than making sure the buy signals are not under a "takeover offer" or under a "deed of arrangement" (a court order) that I mentioned earlier.

Skate.
 
SAP LOGO.jpg

Here are a few general comments about the SAP Strategy
The SAP strategy is a mechanical trend trading strategy that aims to identify profitable trading opportunities in the All Ordinaries index (XAO). It uses a combination of indicators and filters, including the Hann filter, Volatility parameters, Main market parameters, Ulcer Index Indicator, Elder Impulse parameters, Percentage Mode parameters, and the "Percentage Up" filter, to generate buy signals.

The Hann filter is used to smooth out short-term noise and identify the direction of the trend. It is based on a moving average of the closing price, with an "optimised" nPeriod. To further clarify the Hann Filter, a longer nPeriod will result in a smoother trend, while a shorter nPeriod will be more reactive to short-term fluctuations.

The volatility parameters in conjunction with the average true range parameters (ATR) are used to adjust the multi-stage exit strategy and the take-profit exit based on these two indicators. This is important because a market with higher volatility will require wider exit criteria levels to avoid being stopped out too early, while a market with lower volatility will require tighter stop-loss levels to minimise risk.

The main market parameters, are the engine of the SAP strategy, filtering out trades that do not comply with the set parameters or that is not in line with the overall market trend. Once everything falls within the parameter range, trades are compared to the volume-weighted moving average, and only trades that align with the trend direction are generated, making this a simple yet effective trading procedure.

The Ulcer Index indicator measures the risk of a trade by taking into account both the size and duration of drawdowns. This is important because a trade with a large drawdown that lasts for a long time can be riskier than a trade with a smaller drawdown that lasts for a short time.

The Elder Impulse Parameters are used to filter out trades that are not in line with the momentum of the market. This is done by analysing the relationship between the price and the moving average and only taking trades when the momentum is in the direction of the trend.

The Percentage Mode parameters in the SAP strategy adjust the position size based on the trading account balance, ensuring that outstanding funds are equally distributed among positions to fill the portfolio.

The "Percentage Up" filter is a timing filter that allows the SAP strategy to generate buy signals only when 50% of the (XAO) index is advancing over a nPeriod. At all other times, it restricts buy signals from being generated. This can help to filter out trades that are not likely to be profitable, based on the current market conditions.

The SAP strategy is designed to work in a top-down approach, with the different indicators and filters working together to generate signals. The strategy is designed to be used in a systematic manner, with no discretionary input other than what I mentioned in my previous post.

Ultimately, the final decision to enter or exit a trade may depend on the trader's interpretation of the overall picture, such as announcements pertaining to each individual signal. While modifications or adjustments can be made based on the trader's preference, the SAP strategy is designed to be used as a comprehensive trading plan that aims to identify profitable trading opportunities only when 50% of the constituents in the (XAO) index are advancing over a given nPeriod.

The SAP Strategy has been coded to have a cautious approach when buying a position and cut those positions loose quickly when they fail to perform as expected. This strategy is designed to be slow and methodical in its approach to trading and is well-suited for those just starting out.

Skate.
 
Top