Australian (ASX) Stock Market Forum

Dump it Here

"Trading for Beginners - Skate's Practical Guide to Profitable Trading"
A daily series of posts aimed at those just starting out on their trading journey.

62. Managing trading positions
It is critical to overcome the fear of selling in order to efficiently manage trading positions. Rather than holding onto a position in the hope of seeing it improve, it is best to sell when it is no longer performing as expected. This requires a well-defined exit strategy that corresponds to your risk tolerance and personal preferences.

It is important for traders to understand that there is no one-size-fits-all method to trading and it's imperative to develop their own strategy appropriately. Long-term success requires learning from losses and altering strategies in response to changing market conditions. Strategy improvements are always ongoing.

While knowledge is vital, putting that information into practice is what produces outcomes. Trading success, like success in every other field, needs not only knowledge but also action.

Traders should expect losses, trading errors, and setbacks along the way. Learning from these experiences and fine-tuning their strategy accordingly can go a long way to achieving long-term trading success. The ability to adapt based on knowledge and experience is a valuable asset for building wealth over time.

Despite the number of trading analysis resources available, such as trading books, YouTube, Twitter, and dedicated websites, many traders struggle to regularly earn a profit. Nonetheless, traders can boost their chances of success and reach their trading objectives with dedication, enthusiasm, and gained experience.

The truth is that most traders who try to make money through trading will fall short. This is caused by a variety of reasons, including the market's high degree of unpredictability, the complexity of the market, and the impact of emotions on a trader's decision-making process.

Skate.
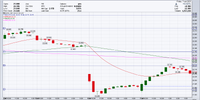
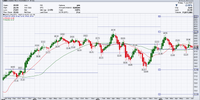
Pretty rough week on ASX:


Screen Shot 2023-07-08 at 1.07.56 PM.png


With only 3 positions opened, the system was pretty good in keeping you out of the market. I guess all those filters were working!

jog on
duc
 
Pretty rough week on ASX:

Screenshot 2023-07-08 120155.jpg

@ducati916, the trading week started on a positive note, with many traders feeling optimistic about the market. However, things took a turn for the worse on Thursday and Friday for the 3 positions held in the SAP Strategy. As trader sentiment changed, so did the profits of the SAP strategy leading to a weekly loss of (-$1,244.11) after being up as much as +$2,957.23 on Wednesday.

There are a few factors that contributed to this shift in sentiment. One of the biggest concerns is that inflation is not being controlled quick enough.

In addition to inflation concerns, it may have been the combination of some geopolitical issues with increased tensions between the US and China, as well as concerns about the ongoing situation in Afghanistan.

These factors have made world markets nervous, affecting our market with a general pullback overall. When market sentiment changes nothing seems to get spared.

Overall, the change in trader sentiment serves as a reminder of the volatility of the stock market. While it can be tempting to get caught up in short-term gains, it's important to remember that the market can be unpredictable and that there are always risks involved.

Skate.
 
With only 3 positions opened, the system was pretty good in keeping you out of the market. I guess all those filters were working!

@ducati916 after making a few general comments about system trading it would be the ideal time to make my next three daily posts about system trading, technical analysis, and system trading in a nutshell for others to understand more about this style of trading.

Sundays posts
63. System Trading is challenging, but not impossible

Mondays post
64. More on technical analysis

Tuesdays post
65. System trading in a nutshell

Skate.
 
"Trading for Beginners - Skate's Practical Guide to Profitable Trading"
A daily series of posts aimed at those just starting out on their trading journey.

63. System Trading is challenging, but not impossible
System trading can be challenging to master but is a highly rewarding method that demands unwavering dedication, substantial knowledge, and strict discipline in execution. One of the crucial factors to succeed in this approach is to learn from the experiences of other seasoned system traders.

To gain a deeper understanding of the rationale behind system trading and stay on track, traders can benefit from reading relevant materials and watching educational videos on platforms like YouTube. As traders gain more experience, they can gradually transition to more advanced mathematical modelling techniques to ensure that their strategy remains relevant and effective amidst the ever-changing market conditions.

Successful system trading entails not only executing buy and sell orders but also precisely managing positions. Effective position management requires a solid trading strategy that includes well-defined exit points and diligent risk management. Traders can minimise losses and maximise profits by implementing these strategies.

Traders must maintain a consistent approach, especially in the midst of market volatility, and avoid making rash or emotional decisions that could harm their performance. Keeping a clear head and sticking to the strategy can help traders reach their long-term goals.

System trading is often likened to a game of probabilities, where success hinges on comprehending the mathematical principles underlying market trends and patterns. By leveraging mathematical models and historical data to analyse market trends, traders can make well-informed trading decisions.

To overcome emotional biases and maintain focus on data and probability, many traders rely on mechanical trading techniques that employ pre-defined rules and algorithms. Although this approach requires a higher level of knowledge and skill, it can offer greater flexibility and adaptability to changing market conditions. By adopting mechanical trading methods, traders can enhance their chances of success in the dynamic and ever-evolving world of system trading.

In conclusion, system trading demands discipline, knowledge, and competence. It is not an easy road, but with perseverance, self-control, and a well-defined trading plan, success is attainable. Learning from other traders, prioritising position management, and comprehending the fundamental mathematical principles of market trends and patterns are all critical components of system trading success.

Skate.


Given that the strategy is a trend following strategy...

Screen Shot 2023-07-09 at 12.15.23 PM.png

And your market is sideways, hardly surprising.

The system obviously kept you out with only 3 buy orders last week.

I mention again the 50%/30%/20% rule. 50% of a stock's movement is reliant on overall market movement. 30% of its movement is attributable to its sector. 20% to the stock itself based on news, earnings, etc.

You are in major chop.

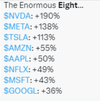
In the US only the Evil 8 are actually doing anything. Everything else is chop. I don't know if the ASX has any AI stocks. If not, forget about it. I posted these on my blog earlier:

Screen Shot 2023-07-09 at 12.27.50 PM.pngScreen Shot 2023-07-09 at 12.27.59 PM.png

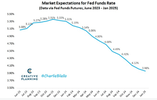
Then add in the Fed adding 2 further rate hikes:

Screen Shot 2023-07-09 at 12.26.52 PM.png

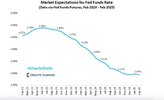
Pushing the curve higher from previously

Screen Shot 2023-07-09 at 12.26.31 PM.png

I don't see 'trending higher' going forward unless the E8 can push the NASDAQ higher on euphoria alone. Historically in the 1920's we had the Investment Trusts, the 60's Conglomerates, 70's Nifty Fifty, 90's DotComs, 00's FAANG, and now E8. It will, as usual, end badly.

We have entered 'fiscal dominance' in the US. Same in Europe. The European banks are leveraged 20X. Another 2 rate hikes? Really?

So I would expect your system to take very few trades unless the commodity sector catches fire at some point. Banks I wouldn't touch long, or any financial to be honest...just too risky currently.

jog on
duc
 
Given that the strategy is a trend following strategy and your market is sideways, hardly surprising. The system obviously kept you out with only 3 buy orders last week.

I mention again the 50%/30%/20% rule. 50% of a stock's movement is reliant on overall market movement. 30% of its movement is attributable to its sector. 20% to the stock itself based on news, earnings, etc.

You are in major chop.

@ducati916, to be perfectly honest the SAP Strategy was coded with those new to system trading in mind, Traders who want all the benefits of system trading without too much of the stress that accompanies this style of trading. Overall, to achieve all this, the SAP trading strategy is a little complex but it brings technical analysis and risk management together in a simplistic way.

The SAP Strategy is designed with various indicators and filters to achieve the objective in line with my daily series of posts. In the first week of trading the SAP Strategy has not gone to plan. Market sentiment changed at the end of the week and the positions in the strategy weren't spared. The change in trader sentiment serves as a reminder of the volatility and unpredictability that can turn the markets on a dime.

In the next post, I'll explain a little more about how the SAP strategy works.

Skate.
 
SAP New LOGO.jpg

The SAP trading strategy is a mechanical trading system that identifies trades by combining indicators and filters to sort the wheat from the chaff. The main purpose of these indicators and filters is to generate trading signals with a high likelihood of success and to manage risk effectively.

Stepping through the SAP Strategy the first major component is a momentum filter. This filter is used to identify whether the market is currently in an uptrend or a downtrend. It does this by comparing the current price to a moving average of the price over a specified period of time. If the current price is above the moving average, the momentum filter indicates that the market is in an uptrend. If the current price is below the moving average, the momentum filter indicates that the market is in a downtrend.

By combining the turnover, volume, price, and index momentum filters, only positions that meet all the requirements are passed to the conditional buy filter. The turnover filter requires a minimum turnover to be achieved, while the volume filter ensures that the average volume of shares traded is greater than the minimum specified in the parameter settings. The price filter simply selects positions with a minimum and maximum dollar value. Selecting positions with a lower price range magnifies percentage increases relative to the price. The momentum filter is the final piece of the puzzle, ensuring that the momentum of the overall index is in line with the longer-term trend of the market, thereby increasing the probability of success for generated signals.

The SAP Strategy also includes a risk-management position sizing model. The trade size is determined by the account balance and risk tolerance. The SAP strategy also contains a take-profit stop in addition to the position sizing model, which is used to lock in profits. The take-profit stop level is determined by the market's volatility and the intended profit aim. The position is automatically closed when the take-profit stop level is reached, and the profits are locked in.

The "Percentage Up" conditional buy filter is at the heart of the SAP Strategy to keep nervous traders as safe as possible by only generating bullish signals based on the percentage of positions in the All Ordinaries (XAO) watchlist that are in an uptrend. The "Conditional Buy Filter" is set to "PercentageBullish", which means that the conditional buy filter will generate a buy signal if the percentage of positions in the (XAO) watchlist that are in an uptrend, that is greater than 50% within the index.

The "PercentageBullish" and "PercentageBearish" variables are then used to generate a bullish or bearish signal based on the percentage of positions that are in an uptrend. If the percentage is greater than 50%, the signal is bullish. If the percentage is less than 25%, the signal is bearish. Finally, the "Percentage Up" filter plots a colored ribbon (green) on the bottom of the chart to indicate when a buy signal can be generated by the conditional buy filter.

Overall, the SAP trading approach is designed to identify potential trades with a high likelihood of success and to efficiently manage risk. As traders acquire more coding skills, they can combine any position size model and the take-profit stops to manage risk more effectively.

Skate.
 
View attachment 159301


The "PercentageBullish" and "PercentageBearish" variables are then used to generate a bullish or bearish signal based on the percentage of positions that are in an uptrend. If the percentage is greater than 50%, the signal is bullish. If the percentage is less than 25%, the signal is bearish. Finally, the "Percentage Up" filter plots a colored ribbon (green) on the bottom of the chart to indicate when a buy signal can be generated by the conditional buy filter.


Skate.

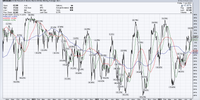
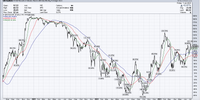
While I agree with all of your filters, this is the one that can cause issues:

Screen Shot 2023-07-09 at 3.40.16 PM.pngScreen Shot 2023-07-09 at 3.39.42 PM.png

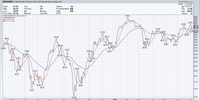
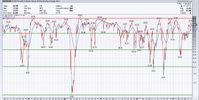
Same data as a % moving higher:

Screen Shot 2023-07-09 at 3.45.30 PM.pngScreen Shot 2023-07-09 at 3.43.53 PM.png

While the trend is bullish, the pullbacks can whipsaw you.

I'm guessing that you are willing to be whipsawed rather than widen exit conditions. Swings and roundabouts. May well not be an issue in a trending market, but the ASX is sideways currently.

jog on
duc
 
What am I messing Duc that this 2nd graph of % stock above MA 200 day can go above 100% ?? ?


Mr Newt,

The first 2 charts are called 'performance'. They don't track the % of stocks moving in the index. That % is measured in the second 2 charts.

Performance shows the tendency for stocks to revert to mean. In this case, reversion to simple moving averages. It illustrates the risk of a high % number in advancing stocks, pulling back.

It gives you an idea of whipsaws and placement of initial stops (if you use them of course).

jog on
duc
 
(a) I'm guessing that you are willing to be whipsawed rather than widen exit conditions. (b) Swings and roundabouts. (c) May well not be an issue in a trending market, but the ASX is sideways currently.

@ducati916 there is a bit to unpack in that sentence. Let me address your points:

(a) The SAP Strategy uses a "Percentage Up" conditional buy filter to ensure buy signals are only generated when the "PercentageBullish" variable percentage is greater than 50% of the index being traded. However, I would like to provide some additional details on how the strategy responds to changes in trends. When trends change, it affects not only the percentage of bullish companies in the index, but also volume, volatility, and momentum, which the SAP Strategy monitors closely. If a position fails to perform outside a mathematical equation within "two bars," the position is cut loose. This helps the strategy to quickly respond to changes in market conditions and avoid prolonged losses.

(b) When it comes to "swings and roundabouts" they have no influence on the SAP Strategy. It is a systematic trading methodology that works on mathematical equations and "black or white" conditions. To clarify, by "swings and roundabouts," I believe you may be referring to the ups and downs of trading, which can be unpredictable and difficult to navigate. While this is true, the SAP Strategy is designed to identify and respond to market conditions in a consistent and methodical manner, which can help to mitigate some of the risks associated with trading.

(c) Trend trading works best when markets are trending higher. However, the SAP Strategy has filters and indicators in place to respond to changing market conditions. For example, the strategy uses weekly indicators and filters to monitor market conditions and adjust positions accordingly. While this may involve some pain of losing a portion of open profits, it is a fact of life when trading with this methodology. To provide a specific example, one position in the portfolio has been placed in the pre-auction for sale on Monday, which demonstrates the effectiveness of the SAP Strategy in responding to changing market conditions.

I hope this helps to clarify how the SAP Strategy works a little better on how it responds to changing market conditions.

Skate.
 
Last edited:
Performance shows the tendency for stocks to revert to mean. In this case, reversion to simple moving averages. It illustrates the risk of a high % number in advancing stocks, pulling back.

It gives you an idea of whipsaws and placement of initial stops (if you use them of course).

@ducati916, if I make a few additional comments even though your answer was direct at @Newt.

You are correct that there is a tendency for stocks to revert to the mean, and that this can be illustrated by reversion to simple moving averages. This is an important consideration when using any trading strategy, including the SAP Strategy.

Regarding your point about the risk of a high percentage of advancing stocks pulling back, this is an important consideration when using any trading strategy that relies on bullish signals. The SAP Strategy uses a "Percentage Up" conditional buy filter to ensure that buy signals are only generated when the "PercentageBullish" variable percentage is greater than 50% on the index being traded. However, as you point out, there is always a risk of whipsaws and pullbacks when trading in a volatile market.

To address this risk, the SAP Strategy uses a range of risk management techniques, including the placement of initial stops. While the strategy is designed to ride out short-term volatility, it also has measures in place to respond quickly to changes in market conditions and avoid prolonged losses.

Overall, the SAP Strategy is designed to take into account a range of market factors, including the tendency for positions to revert to the mean and the risk of whipsaws and pullbacks. By using a range of risk management techniques, the strategy aims to minimise losses and maximise gains in a consistent and methodical manner.

Skate.
 
NYSE.jpg

@ducati916, thank you for providing the NYSE ($NYA50R) chart, which shows the percentage of stocks that are above the index's 50-day moving average. While this chart is useful in some situations, I have discovered that it is not practical for designing probability software relating to the ASX.

While it is feasible that the results of this chart could be used in some way, doing so efficiently is beyond my experience. Creating probability software requires a thorough understanding of statistical analysis as well as the capacity to analyse vast amounts of data effectively. While the NYSE ($NYA50R) chart can provide some insight into market movements, it is only one of several tools available to traders to help them make trading decisions.

Overall, while the NYSE ($NYA50R) chart may be beneficial in some situations, it is not a realistic tool for constructing ASX-related probability algorithms. When analysing market trends and making trading decisions, it is critical to employ a variety of tools and strategies.

Whereas the "Percentage Up" filter is a conditional buy filter used in the SAP Strategy that is designed to generate buy signals when the percentage of bullish companies in the index being traded is greater than 50% over a range. This means that the filter will only generate a buy signal when more than half of the companies in the index are experiencing bullish momentum that isn't weighted at all.

By using a threshold of 50%, the "Percentage Up" filter ensures that buy signals are only generated when there is a significant amount of bullish momentum in the market. This can help to reduce the risk of whipsaws and false signals, which can be a common problem when using other types of filters or indicators.

Skate.
 

@ducati916 daily post hyperlinked an article that examines the US dollar's dominance in global reserves, as well as its possible vulnerability as a result of geopolitical concerns and shifting economic conditions. The US dollar has historically been the principal reserve currency utilised by central banks around the world, accounting for more than 60% of global reserves.

However, due to several causes such as the continuing trade war between the United States and China, geopolitical tensions, and the economic impact of the COVID-19 epidemic, this supremacy has come under criticism. Countries such as China and Russia have been looking into alternative currencies such as the euro, Chinese yuan, and gold in order to minimise their reliance on the US dollar.

The essay also analyses the potential implications of the continuing Ukraine crisis on the supremacy of the US dollar. As the United States puts sanctions on Russia, Moscow has been looking for ways to diversify its foreign exchange reserves and promote the use of alternative currencies in trade agreements.

Overall, the piece emphasises the continuous dispute over the US dollar's worldwide supremacy and the problems it faces as economic and geopolitical conditions change. It also shows the growing tendency of countries looking into alternative currencies and diversifying their foreign exchange reserves in order to lessen their reliance on the US dollar.

Skate
 

Carrying on from @ducati916 daily post there is another hyperlink that's worthy of a read. The article above delves into the idea of the BRIC countries (Brazil, Russia, India, and China) developing a gold-backed currency to compete with the US dollar as the world's reserve currency.

This proposal, according to the paper, is unlikely to gain traction and is not a viable answer to the issues created by the US dollar's dominance in global trade. The author highlights that creating a new gold-backed currency would be a difficult and expensive process that would require substantial collaboration and coordination among the BRIC countries.

Furthermore, the article goes on to claim that the US dollar's supremacy is due to factors other than its role as the world's reserve currency, such as the strength and stability of the US economy and political system. While other countries may be able to challenge the US dollar's dominance in some areas, no single currency or group of currencies is projected to take its place as the world's reserve currency in the near future.

Both hyperlinks discuss a very important topic and if you don't take the time to read them at least I've given you an insight of what the articles discuss.

Thanks has to go to the Duc, for stimulating content in his daily posts.

Skate.
 
Just Joking ! I pushed the Wrong Button Again
I meant "What a Joke" and could not stop Laughing
I love a Good Joke
The Americans have Never Lost a Cold War!!!

Blimey! Can you see Russia being invited to any dinner party for 4?
 
Mr Newt,

The first 2 charts are called 'performance'. They don't track the % of stocks moving in the index. That % is measured in the second 2 charts.

Performance shows the tendency for stocks to revert to mean. In this case, reversion to simple moving averages. It illustrates the risk of a high % number in advancing stocks, pulling back.

It gives you an idea of whipsaws and placement of initial stops (if you use them of course).

jog on
duc

Still don't get it Duc? From what you say, perhaps the first 2 graphs are indicators within Stockcharts track the "performance" metric you describe? The tickers and MAs on the corresponding 50 and 200 moving average seem the same. I also notice the non-performance % above MA graphs have log Y axis - perhaps to highlight pullbacks more easily?

Is there a description of how the Performance indicator/metric is calculated somewhere? Totally agree market internals based around "% above MA" can be very valuable for judding market risk and opportunity over varying timeframes.
 
"Trading for Beginners - Skate's Practical Guide to Profitable Trading"
A daily series of posts aimed at those just starting out on their trading journey.

64. Technical analysis methodical approach
Technical analysis is a useful tool that allows a methodical approach to analysing market trends and patterns. Using predetermined rules and algorithms to make trading decisions removes the guesswork that is frequently responsible for subpar trading performance and outcomes.

Technical analysis simply involves analysing market trends and patterns with the help of technical indicators, parameters, and filters. This method of trading is especially effective for traders looking to profit from market volatility by pinpointing the entry and exit points for a trade.

The main advantage of technical analysis is that it allows traders to make data-driven decisions based on historical market data. Using technical analysis can help lessen the impact of emotional biases and subjective assessment, which can be difficult for new traders to overcome.

Traders can use a variety of technical indicators and mathematical tools in conjunction with or in isolation to analyse market trends and patterns. Understanding the concept and including the support and resistance levels in a strategy is one of the most significant components of technical analysis.

Support levels are price levels where buying pressure is strong enough to keep the price from falling any further, whereas resistance levels are price levels where selling pressure is strong enough to keep the price from rising anymore. Identifying these levels allows traders to make better trading decisions and manage risk more efficiently.

Understanding moving averages and trendlines is another part of technical analysis. Moving averages are a useful tool as they work by smoothing out short-term price movements. Whereas trendlines can assist traders in identifying possible market trends. Identifying trends allows traders to make better trading decisions and perhaps profit from market movements that have enough momentum with volume.

It's important to remember that technical analysis is not flawless, and there are no guarantees of success using this trading method. However, traders can boost their chances of success and potentially profit from market volatility by employing a disciplined approach when using technical analysis.

Although certain concepts might help traders succeed, it is critical for traders to stay flexible and responsive to changes in market conditions. This may require changes in their trading technique, such as fine-tuning their risk management method. It's crucial to realise that while understanding the indications used in trading can assist simplify the process, it doesn't ensure success. To be competitive in the market, traders must be willing to constantly learn, adapt, and adjust techniques to "dance with the music being played".

Skate.
 
Comment
System trading doesn't always get it right, but it's better than the alternative.

Skate.
 
Top