Australian (ASX) Stock Market Forum

Dump it Here

@Skate the name of the thread is 'Dump it Hear' so I going to dump something, it's not a pile of trash for kerb side cleanup, I'm sure that people can sort through and find something they can make use of.

Understanding Risk-Adjusted Returns
July 13, 2023 | Tim Fortier


Investments always have an inherent trade-off between potential rewards and risks.
As an investor, it’s crucial to assess the risk-reward profile of your investments to make informed decisions.
One effective tool that helps you achieve this balance is risk-adjusted returns. Today we’ll delve into the concept, its significance, and measurement methods.
First, let’s answer how risk-adjusted returns can assist you in maximizing your investment gains while effectively managing risks.

Defining Risk-Adjusted Returns

Risk-adjusted investment returns are a way of measuring the performance of an investment by considering the amount of risk taken.
This is important because it allows investors to compare the performance of different investments equally, regardless of the amount of risk involved.
There are several different methods for calculating risk-adjusted investment returns. One common method is to use the Sharpe ratio.
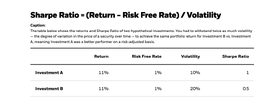
The Sharpe ratio is calculated by dividing the investment’s return by its standard deviation. The standard deviation measures the volatility of the investment’s returns.
A higher Sharpe ratio indicates that the investment has generated a higher return for a given level of risk.
1689287385961.png
In the above example, even though both investments indicate a similar return of 11%, investment A has half the volatility and, thus twice the Sharpe ratio.
If you think of the two as car rides, investment A takes the highway, drives 5 mph under the speed limit, and arrives at the destination right on time.
Investment B may speed, take corners too fast, and may have to brake quickly to avoid traffic.

It’s probably not the car you want to be riding in, as the chance of an accident or ticket is much greater.

There is also something in investing known as volatility drag that can slow down the growth rate. The greater the volatility, the greater the need to make up for periods of negative volatility, which can slow the compounding of money.

The more consistent (or boring) an investment is, the more likely it will reach the financial goal that you have set.

Another common method for calculating risk-adjusted investment returns is the Sortino ratio. The Sortino ratio is like the Sharpe ratio, but it uses a different measure of risk, the downside deviation.
The downside deviation measures the volatility of the investment’s negative returns. A higher Sortino ratio indicates that the investment has generated a higher return for a level of downside risk.
Perhaps the easiest measure of risk to understand is what is known as maximum drawdown.
A drawdown in trading is the percentage you are down from the latest equity peak. It’s a peak-to-trough decline over a certain period. You are in a drawdown if your equity is not at an all-time high. Thus, most of the time, you’ll be in a drawdown.
The reason this is so important to understand is that it influences your behavior and‌ your returns. Both are dependent on each other.
What is a good or acceptable drawdown percentage? There is no definite answer, but preferable to be as low as possible. If it gets too big, more than 20%, many investors lose hope and stop investing.
Thus, 20% can serve as a heuristic for max drawdown. Most investors believe they can handle bigger drawdowns, but we believe they overestimate their pain tolerance.

Why Understanding Risk Is Important

If you have an investment or trading strategy liable to swings in return, it might lead to two things:
  • You might increase the risk of ruin, especially if you are leveraged.
  • Swings in volatility normally lead to behavioral mistakes.
Risk-adjusted investment returns allow investors to compare the performance of different investments equally, regardless of the amount of risk involved, and help them make informed decisions about where to invest their money.
When considering investment choices, while investment returns are important, the best way to view returns is when measured on a risk-adjusted basis.

All things being equal, an investor should strive to select investments that offer high Sharpe and Sortino ratios defined as 1.0 or greater, and maximum drawdowns that are not much greater than the compound annual growth.

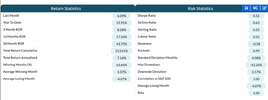
For example, the following tables illustrate the return and risk characteristics of the S&P 500 SPDR (SPY).
1689287559610.png

For the investment period January 2007–June 2023, the CAGR (Total Return Annualized) is 7.16%. But in the next column, you can see that the maximum drawdown is -52.20%.
This is an example of an investment with negative asymmetry, meaning the downside risk is much greater than the expected annualized return.
You can also see that the Sharpe ratio is 0.52, and the Sortino ratio is 0.63.

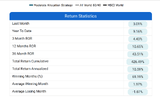
Let’s compare this to a systematic program designed to achieve high-risk-adjusted returns.
1689287640434.png
1689287671558.png
Here we can see that the Total Return Annualized is 10.59%, but yet the Maximum Drawdown is only -7.68%! This is an excellent example of where the investment returns have positive asymmetry, meaning more return with less risk.
Notice too that both the Sharpe ratio and the Sortino ratio are well over 1.00.

Investments with these types of risk measurements will produce more predictable outcomes than the randomness of the market.

Here are some additional tips for using risk-adjusted investment returns:
  • Use risk-adjusted investment returns to compare the performance of different investments.
  • Consider the time horizon of your investment when using risk-adjusted investment returns.
  • Diversify your portfolio among non-correlated assets to reduce risk.
  • Monitor your investments regularly.
  • Consult with a financial advisor to get personalized advice.
1689287793294.png
 
"Trading for Beginners - Skate's Practical Guide to Profitable Trading"
A daily series of posts aimed at those just starting out on their trading journey.

68. Trading can be exciting
Adults of various ages and financial positions may find trading to be an engaging and entertaining pastime. You may want to begin trading for a variety of reasons, including the desire to diversify your income or to indulge in a stimulating hobby.

The flexibility of trading is one of its most appealing features. Traders can conduct business from anywhere in the world at any time, which appeals to people who value autonomy and flexibility. Trading requires a combination of academic ability, risk management skills, and emotional control.

On the other hand, trading may be both difficult and lucrative at the same time. Trading can be very rewarding if you appreciate the adrenaline rush of competition and the satisfaction of overcoming challenges. However, it is critical to recognise that trading is not a "get-rich-quick" scheme. You must be disciplined, patient, and have a long-term vision to succeed.

When starting out you need to set defined goals and construct a solid trading plan and a robust trading strategy while investing in your self-education and personal growth to increase your chances of success. It is critical to monitor market trends and developments and to only act when the market is heading in the right direction.

Trading offers a unique opportunity for financial independence and freedom, allowing you to live independently of a traditional source of income. If you value flexibility and independence in your personal and professional life, trading may be for you. However, this will require a great amount of time and effort.

Overall, while trading involves caution, those willing to put in the time and effort necessary to succeed may find trading to be an intriguing venture owing to the possibility of financial independence and freedom.

Finally, while caution and discipline are required, the prospect of financial independence and freedom can be a strong motivation. Setting goals, developing a good trading plan and strategy, and investing in personal growth and self-education can all help you succeed in this exciting endeavour.

Skate.
 
@Skate the name of the thread is 'Dump it HERE' so I going to dump something, it's not a pile of trash for kerb side cleanup, I'm sure that people can sort through and find something they can make use of.
What is a good or acceptable drawdown percentage? There is no definite answer, but preferable to be as low as possible. If it gets too big, more than 20%, many investors lose hope and stop investing.

@DaveTrade, that is a good find & well worthy addition to the "Dump it here" thread. After reading through your post, I would have to agree with most of the metrics thrown around in the article but a Drawdown anywhere near 20% would stop most traders even if they have nerves of steel.

Focusing solely on percentages can lead traders to overlook the significant impact of drawdowns on their portfolios. While a drawdown of 20% may seem acceptable at first glance, converting percentages to dollars can provide a more accurate understanding of the true impact on your portfolio. As traders, it's important to prioritise risk management and not let percentages fool us into a false sense of security.

It's crucial to recognise that percentages are relevant to the size of your portfolio. A drawdown of -20% may be bearable on a $20k portfolio, but it can be devastating and hard to swallow on a larger portfolio. For example, on a $100k portfolio, a -20% drawdown takes on a new meaning, while on a $1m portfolio, a -20% drawdown becomes very relevant indeed, resulting in a loss of $200k. Trading a $2m portfolio with a -20% drawdown can be catastrophic, with $400k down the drain.

Therefore, it's essential to consider the impact of drawdowns in dollars and not just percentages. By doing so, traders can gain a more accurate understanding of their risk exposure and develop a more effective risk management plan to protect their portfolios.

Skate.
 
67. Drawdowns are scary
Losses and drawdowns are unpleasant for any trader, especially those who are new to trading.

@DaveTrade, thanks for sharing that insightful article, as it provides an excellent opportunity to emphasise the importance of drawdowns and how scary they can be. As traders, we tend to overlook significant drawdowns when a method is profitable, but this approach is problematic as it prioritises profits over risk management. It's crucial to recognise that drawdowns deserve just as much attention as profits, if not more, as they are a critical measure of risk exposure in trading.

The ability of a trader to tolerate drawdowns "not excessive drawdowns" is crucial when it comes to risk management. A high drawdown can be emotionally and financially taxing, so before you embark on any trade, assess the magnitude of the drawdown you believe you can handle. It's worth emphasising that your ability to control drawdown will be put to the test in ways you never imagined feasible. As a result, it's critical to have a sound risk management strategy in place that considers the maximum drawdown you can tolerate.

Other factors that may influence drawdowns, such as holding period and number of trades, should also be considered. A longer holding period, for example, may result in a higher drawdown, but an increase in the number of winners with a decrease in the number of trades may result in a lesser drawdown. As a result, it is critical to consider these elements while designing a risk management approach for your trading strategy.

Aside from managing drawdowns, it is critical to strive for a lesser drawdown, which results in better CAR/MDD statistics and other essential metrics. Traders can acquire a more accurate knowledge of their strategy's performance and make more educated judgements regarding risk management and position sizing by using a comprehensive methodology that takes into account several other parameters.

Overall, traders must recognise the significance of drawdowns and prioritise risk management alongside profits. Traders can establish a more sustainable and effective trading strategy in the long run by doing so.

Skate.
 
IMHO a 20% Drawdown is Excessive
We all make mistakes as traders, but accepting "excess risk" should not be one of them. While a 20% drawdown may appear routine, it is critical to understand that this degree of risk can be emotionally and financially catastrophic. As an experienced trader, I've learned the value of prioritising risk management and adopting a realistic attitude for new traders just starting out on their trading journey.

When it comes to trade, this comes to mind
When starting out "new traders" are concerned with what they "can make," whereas "seasoned traders" are concerned with what they "could lose."

Skate.
 
"Trading for Beginners - Skate's Practical Guide to Profitable Trading"
A daily series of posts aimed at those just starting out on their trading journey.

I've decided to call it quits on the "Trading for Beginners" series after 69 daily posts. I've realised that my enthusiasm for the project has shifted. I hope the information presented has been beneficial to those who are just starting out.

Throughout the series, I attempted to explain how to create effective trading habits and the importance of risk management, position sizing, technical analysis, and trading psychology. I also offered some of my own personal trading experiences and views.

While trading can be difficult and complex, it's vital to remember that anyone can learn, however, developing these skills requires hard work, determination, dedication, and an interest to learn.

Skate.
In all sincerity, a very big well done. A credit to you. Most informative.

Have a very nice weekend.


Kind regards
rcw1
 
Duc's Quote of the day.jpg

I found @ducati916's daily series of posts to be very informative today and particularly enjoyed the Wayne Gretzky quote he shared. While the original quote is great, I personally prefer the phrase "dance to the music being played" as it encapsulates the idea of adapting to changing circumstances.

Skate.
 
Off-loading a position is the key to successful trading
Successful trading is simply buying a position purely with the intention of selling it to someone else at a higher price. It's a simple concept, yet it's mighty tough to implement correctly, and consistently. Good traders are calculated risk-takers who understand how to manage risk and maximise earnings.

Risk management is a delicate balancing act
Traders must discover the appropriate amount of risk for them. They must also understand when to sell, whether to profit or to cut losses. Risk management is critical to trading success. It is critical to "dance to the music being played" and choose the best plan for your risk tolerance.

Skate.
 
Backtesting is a great tool for traders
But keep in mind that prior backtesting results using historical data don't always predict future performance. Paper trading can be an excellent approach to test the effectiveness of a system before investing real money. The final test of a trading system's worth is live trading.

It's important to understand that trading isn't an equal playing field
Professional traders and multinational corporations have greater access to information and resources than the typical retail trader. It's critical to concentrate on survival and learning how to stay in the game.

Skate.
 
To make money, you must first have money
It is not possible to turn a tiny account into a million-dollar account overnight. Instead, traders should aim for a relatively modest annual average return of 25%. It all comes down to your risk tolerance and trading style.

In short, successful trading is all about risk and risk management
Trading is not about making "quick money" or "outwitting the market" it's a game of endurance and longevity. Traders can boost their chances of long-term success by determining the appropriate level of risk and focusing on survival. One piece of advice that is commonly overlooked is to "only trade with money you can afford to lose". If you can trade will money you can "truly afford to lose" trading will be less emotional and to some extent "stress-free", but it's rarely the case.

Skate.
 
I trust that any future modifications would be minor. Like, including a close above the prior weeks high to be included with the 50% up requirement. However I would suggest that even this minor mod should be back tested to see if it does improve the system.

@peter2, thank you for suggesting that I include a "close above the prior week's high" with the 50% up conditional buy filter. Based on your suggestion, I conducted a series of backtests to see if the modification would have any impact on the performance of the "SAP Trading Strategy".

During the backtest period from 14th July 2021 to midday today, both the "Peter's - System One" strategy and the "SAP - System Two" strategy produced positive returns. However, to determine which system performed better, we need to compare their performance metrics.

I have used several key performance metrics to evaluate the systems' performance and determine if the modification made a significant difference.

The "SAP - System Two" strategy outperformed "Peter's - System One" strategy in terms of ending capital, net profit, net profit percentage, and annual return percentage. The difference in ending capital was $7,530.02, indicating that the "SAP - System Two" strategy generated higher returns.

Furthermore, the "SAP - System Two" strategy had a higher risk-adjusted return percentage and a higher CAR/MaxDD ratio, indicating that it generated a higher return for every unit of risk taken.

Both systems had the same transaction cost and the same number of trades, but the "SAP - System Two" strategy had a slightly higher average profit/loss, profit factor, and payoff ratio.

In terms of drawdowns, the "SAP - System Two" strategy had a lower maximum system drawdown percentage and a higher Ulcer Performance Index, indicating that it had a more consistent performance.

Overall, based on these metrics, the "SAP - System Two" strategy outperformed "Peter's - System One" strategy, which included Peter's suggested code addition.

Summary

Even though the backtests were slightly different, in the grand scheme of things, it would make little difference which strategy was traded. However, based on the metrics evaluated, the "SAP - System Two" strategy outperformed "Peter's - System One" strategy, even with the suggested code modification.

However, it is essential to note that backtesting results do not guarantee future performance. The exercise was valuable in evaluating the impact of the suggested modification on the system's performance. Thank you Peter for your suggestion.

Comparison.jpg

Equity Comparison.jpg

Skate.
 
Apropos of nothing, I just want to say that here in Aust we have by far the worst trading products and services in the developed world. And highest brokerage.
Very strange that no one has taken up the opportunity to provide a decent, fully featured brokerage + platform here.

IB is really the only option but I don't like it for various reasons.
 
SAP LOGO.jpg

Angry Small.jpg

Update
I've decided that I won't be trading the SAP Strategy until I have thoroughly tested and evaluated it through paper trading. I realised that in my initial haste, I made a couple of mistakes that were pointed out by @peter2. With real money on the line, I know that I need to be extra careful and not take any unnecessary risks.

Therefore, I believe it's only fair to myself and my family members to halt live trading of the SAP strategy until I have thoroughly tested and evaluated the strategy. By paper trading the strategy, I can gain a better understanding of its strengths and weaknesses, as well as its performance in different market conditions. This will allow me to make informed decisions and adjust the strategy as necessary before risking any actual money.

I understand that patience is key when it comes to trading. Rushing into live trading without proper preparation and testing can lead to costly mistakes and losses. So, I will take the time to do my due diligence and make sure that I have a solid plan in place before putting any real money on the line.

If anyone is curious, I'd like to clarify that I will reimburse the minor loss sustained thus far. I accept full responsibility for my errors and believe that making amends is only fair. Furthermore, I want to reassure my family members that their funds would be fully refunded.

I understand that trading can be volatile and that losses are unavoidable. However, I want to be certain that my trading decisions have no impact on my family members and that they have complete trust in me. As a result, I will take the appropriate actions to fix the situation and guarantee that they are not financially damaged.

Being upfront and accountable in these instances, in my opinion, is critical for establishing trust and sustaining healthy relationships with family members. I believe that by accepting responsibility and compensating for the losses, I can demonstrate my dedication to their financial well-being as well as my commitment to trade with caution and care.

Skate.
 
@peter2, thank you for suggesting that I include a "close above the prior week's high" with the 50% up conditional buy filter. Based on your suggestion, I conducted a series of backtests to see if the modification would have any impact on the performance of the "SAP Trading Strategy".

During the backtest period from 14th July 2021 to midday today, both the "Peter's - System One" strategy and the "SAP - System Two" strategy produced positive returns. However, to determine which system performed better, we need to compare their performance metrics.

I have used several key performance metrics to evaluate the systems' performance and determine if the modification made a significant difference.

The "SAP - System Two" strategy outperformed "Peter's - System One" strategy in terms of ending capital, net profit, net profit percentage, and annual return percentage. The difference in ending capital was $7,530.02, indicating that the "SAP - System Two" strategy generated higher returns.

Furthermore, the "SAP - System Two" strategy had a higher risk-adjusted return percentage and a higher CAR/MaxDD ratio, indicating that it generated a higher return for every unit of risk taken.

Both systems had the same transaction cost and the same number of trades, but the "SAP - System Two" strategy had a slightly higher average profit/loss, profit factor, and payoff ratio.

In terms of drawdowns, the "SAP - System Two" strategy had a lower maximum system drawdown percentage and a higher Ulcer Performance Index, indicating that it had a more consistent performance.

Overall, based on these metrics, the "SAP - System Two" strategy outperformed "Peter's - System One" strategy, which included Peter's suggested code addition.

Summary
Even though the backtests were slightly different, in the grand scheme of things, it would make little difference which strategy was traded. However, based on the metrics evaluated, the "SAP - System Two" strategy outperformed "Peter's - System One" strategy, even with the suggested code modification.

However, it is essential to note that backtesting results do not guarantee future performance. The exercise was valuable in evaluating the impact of the suggested modification on the system's performance. Thank you Peter for your suggestion.

View attachment 159566

View attachment 159567

Skate.
I love seeing these sorts of write ups Skate. Its thoughtful, its quantitative, it generates ideas.
IMHO these isn't a statistical difference here - you're still down in the "noise floor" for statistical uncertainly.

Good lesson and reminder for all though - any idea small, big, crazy or well thought out should be tested (very carefully) in the backtesting furnace.
 
@Skate the name of the thread is 'Dump it Hear' so I going to dump something, it's not a pile of trash for kerb side cleanup, I'm sure that people can sort through and find something they can make use of.

Understanding Risk-Adjusted Returns
July 13, 2023 | Tim Fortier


Investments always have an inherent trade-off between potential rewards and risks.
As an investor, it’s crucial to assess the risk-reward profile of your investments to make informed decisions.
One effective tool that helps you achieve this balance is risk-adjusted returns. Today we’ll delve into the concept, its significance, and measurement methods.
First, let’s answer how risk-adjusted returns can assist you in maximizing your investment gains while effectively managing risks.

Defining Risk-Adjusted Returns

Risk-adjusted investment returns are a way of measuring the performance of an investment by considering the amount of risk taken.
This is important because it allows investors to compare the performance of different investments equally, regardless of the amount of risk involved.
There are several different methods for calculating risk-adjusted investment returns. One common method is to use the Sharpe ratio.
The Sharpe ratio is calculated by dividing the investment’s return by its standard deviation. The standard deviation measures the volatility of the investment’s returns.
A higher Sharpe ratio indicates that the investment has generated a higher return for a given level of risk.
View attachment 159546
In the above example, even though both investments indicate a similar return of 11%, investment A has half the volatility and, thus twice the Sharpe ratio.
If you think of the two as car rides, investment A takes the highway, drives 5 mph under the speed limit, and arrives at the destination right on time.
Investment B may speed, take corners too fast, and may have to brake quickly to avoid traffic.

It’s probably not the car you want to be riding in, as the chance of an accident or ticket is much greater.

There is also something in investing known as volatility drag that can slow down the growth rate. The greater the volatility, the greater the need to make up for periods of negative volatility, which can slow the compounding of money.

The more consistent (or boring) an investment is, the more likely it will reach the financial goal that you have set.

Another common method for calculating risk-adjusted investment returns is the Sortino ratio. The Sortino ratio is like the Sharpe ratio, but it uses a different measure of risk, the downside deviation.
The downside deviation measures the volatility of the investment’s negative returns. A higher Sortino ratio indicates that the investment has generated a higher return for a level of downside risk.
Perhaps the easiest measure of risk to understand is what is known as maximum drawdown.
A drawdown in trading is the percentage you are down from the latest equity peak. It’s a peak-to-trough decline over a certain period. You are in a drawdown if your equity is not at an all-time high. Thus, most of the time, you’ll be in a drawdown.
The reason this is so important to understand is that it influences your behavior and‌ your returns. Both are dependent on each other.
What is a good or acceptable drawdown percentage? There is no definite answer, but preferable to be as low as possible. If it gets too big, more than 20%, many investors lose hope and stop investing.
Thus, 20% can serve as a heuristic for max drawdown. Most investors believe they can handle bigger drawdowns, but we believe they overestimate their pain tolerance.

Why Understanding Risk Is Important

If you have an investment or trading strategy liable to swings in return, it might lead to two things:
  • You might increase the risk of ruin, especially if you are leveraged.
  • Swings in volatility normally lead to behavioral mistakes.
Risk-adjusted investment returns allow investors to compare the performance of different investments equally, regardless of the amount of risk involved, and help them make informed decisions about where to invest their money.
When considering investment choices, while investment returns are important, the best way to view returns is when measured on a risk-adjusted basis.

All things being equal, an investor should strive to select investments that offer high Sharpe and Sortino ratios defined as 1.0 or greater, and maximum drawdowns that are not much greater than the compound annual growth.

For example, the following tables illustrate the return and risk characteristics of the S&P 500 SPDR (SPY).
View attachment 159547

For the investment period January 2007–June 2023, the CAGR (Total Return Annualized) is 7.16%. But in the next column, you can see that the maximum drawdown is -52.20%.
This is an example of an investment with negative asymmetry, meaning the downside risk is much greater than the expected annualized return.
You can also see that the Sharpe ratio is 0.52, and the Sortino ratio is 0.63.

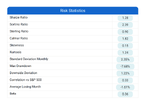
Let’s compare this to a systematic program designed to achieve high-risk-adjusted returns.
View attachment 159548
View attachment 159549
Here we can see that the Total Return Annualized is 10.59%, but yet the Maximum Drawdown is only -7.68%! This is an excellent example of where the investment returns have positive asymmetry, meaning more return with less risk.
Notice too that both the Sharpe ratio and the Sortino ratio are well over 1.00.

Investments with these types of risk measurements will produce more predictable outcomes than the randomness of the market.

Here are some additional tips for using risk-adjusted investment returns:
  • Use risk-adjusted investment returns to compare the performance of different investments.
  • Consider the time horizon of your investment when using risk-adjusted investment returns.
  • Diversify your portfolio among non-correlated assets to reduce risk.
  • Monitor your investments regularly.
  • Consult with a financial advisor to get personalized advice.
View attachment 159550


The 'Sharpe' ratio does not distinguish between downside volatility (bad if you are long) and upside volatility (good if you are long) and is therefore badly flawed.

The Sortino ratio has its issues also.

The 'Adjusted Sortino' utilises 'losses' rather than volatility as the measure. The 'adjusted Sortino' is directly comparable with the Sharpe and identifies whether a high Sharpe is positively skewed for positive returns (you definitely want this if you are long). A lower 'adjusted Sortino' is negatively skewed (you don't want this if you are long).

You would have thought that the length of time that these metrics have been around, that those 'promoting' them would have a clue.

jog on
duc
 
@DaveTrade, that is a good find & well worthy addition to the "Dump it here" thread. After reading through your post, I would have to agree with most of the metrics thrown around in the article but a Drawdown anywhere near 20% would stop most traders even if they have nerves of steel.

Focusing solely on percentages can lead traders to overlook the significant impact of drawdowns on their portfolios. While a drawdown of 20% may seem acceptable at first glance, converting percentages to dollars can provide a more accurate understanding of the true impact on your portfolio. As traders, it's important to prioritise risk management and not let percentages fool us into a false sense of security.

It's crucial to recognise that percentages are relevant to the size of your portfolio. A drawdown of -20% may be bearable on a $20k portfolio, but it can be devastating and hard to swallow on a larger portfolio. For example, on a $100k portfolio, a -20% drawdown takes on a new meaning, while on a $1m portfolio, a -20% drawdown becomes very relevant indeed, resulting in a loss of $200k. Trading a $2m portfolio with a -20% drawdown can be catastrophic, with $400k down the drain.

Therefore, it's essential to consider the impact of drawdowns in dollars and not just percentages. By doing so, traders can gain a more accurate understanding of their risk exposure and develop a more effective risk management plan to protect their portfolios.

Skate.

Morning Mr Skate,

Let's cut through the woke bs.

If a trader cannot distinguish between a 20% drawdown and what that means in $ they have no business trading.

Consider starting with $100 and we want to end with $100.
Now, the account goes down 20% which means that we are at $80 as 100*(1-.20)=80.
Now, to get an addition $20 back, we could take the fraction 20/80=1/4=.25 or 25% as you want to get a quarter back to get whole again.

Obviously that number gets bigger as the drawdown progresses.

Which brings me back to the earlier discussion: if your system throws out a drawdown number any higher than that 20% you start to run into the negative arithmetic associated with trading, ie. your capital becomes overly depleted and the requirement at say 50% drawdown to earn 100% on capital to return to breakeven, on your depleted capital base this becomes really tough. Of course if you are leveraged you are finished.

In another post you mention you need money to make money. Well yes and no.

If you leverage, you don't need (as much of your own) money. But if you are leveraged a 20% drawdown would be at the outer limits of max pain.

Of course the way to get rich is to use leverage successfully, which entails far higher risk and therefore far lower drawdowns.

If you are rich, why would you want to entail higher risk? It's more about keeping what you have and growing it in a conservative manner. Drawdowns more than 5% would be unacceptable to me. Of course you still want a return that exceeds inflation at the very least.

Remember this chap?


He blew himself up. Luckily for him a platform malfunction saved him. It's at about 5mins in. The hazards of hard stops.

jog on
duc
 
The information you seek is there but you have to decide which parts resonate with you. IMO skip the psycho babble posts as they won't mean much to you yet. It's only when we notice that things are not as easy as it should be that we need to understand what's holding us back. Then the psycho babble may start to make sense.
Let's cut through the woke bs.

If a trader cannot distinguish between a 20% drawdown and what that means in $ they have no business trading.

Those two comments reminded me of what my wife once said to me
"I love you and I love my new woollen blanket, both keep me warm at night but one of them doesn't talk $hit".

Skate.
 
Top