Australian (ASX) Stock Market Forum

Dump it Here

As a systematic trend trader, timing is the keyword

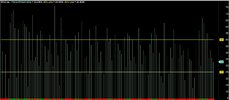
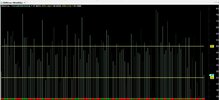
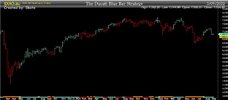
On - Off switch (Weekly XAO)
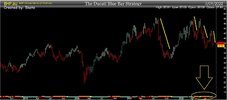
If you only traded the blue bars you would be making money. The beauty of this strategy it works across all periodicities. The yellow ribbon is saying "Danger Will Robinson, danger" (Lost in Space quote) or for the younger generation it's a "Caution Period".
BlueBar .jpg


Skate.
 
@Skate I was thinking along the lines of the bigger system picture, for example, if the system was designed to work in a trending up market then create an indicator to identify when an uptrend with the strength of trend required by the system is present and when the required conditions are not present then the system will stop trading until the right conditions return to the market.
 
@Skate I was thinking along the lines of the bigger system picture, for example, if the system was designed (1) to work in a trending up market then create an indicator to identify when an uptrend with the strength of trend required by the system is present and when (2) the required conditions are not present then the system will stop trading until the right conditions return to the market.

Sure, I have that
I have mentioned this more than once & posted about this indicator a few years back. At the time there was little interest in the indicator as everyone seemed to have their way of doing things. Without an open-mind consideration is never given to a new idea.

Here is such an indicator
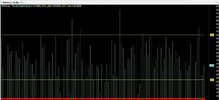
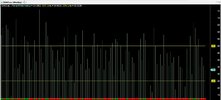
Only buy when the "Percentage of advancing positions in the watchlist exceeds 50%" & sell when the percentage of advancing positions in the watchlist is under 25%. It's crude & dirty but highly effective.

All I'm saying
Don't trade when the ribbon is "RED". That means I would have had rocks in my head buying new positions in the last 4 weeks. You don't need to be a rocket scientist to work that one out.

Percentage Indicator.jpg

Skate.
 
Sure, I have that
I have mentioned this more than once & posted about this indicator a few years back. At the time there was little interest in the indicator as everyone seemed to have their way of doing things. Without an open-mind consideration is never given to a new idea.

Here is such an indicator
Only buy when the "Percentage of advancing positions in the watchlist exceeds 50%" & sell when the percentage of advancing positions in the watchlist is under 25%. It's crude & dirty but highly effective.

All I'm saying
Don't trade when the ribbon is "RED". That means I would have had rocks in my head buying new positions in the last 4 weeks. You don't need to be a rocket scientist to work that one out.

View attachment 146371

Skate.
Hi Skate, I take it that the red and yellow ribbons you refer to are the red and yellow bars down the bottom? And these colours indicate danger zones from what I understand?
 
Hi Skate, I take it that the red and yellow ribbons you refer to are the red and yellow bars down the bottom? And these colours indicate danger zones from what I understand?
I should have quoted post no. 7,421

Oops, forgot my manners, hello Dave
 
Hi Skate, I take it that the red and yellow ribbons you refer to are the red and yellow bars down the bottom? And these colours indicate danger zones from what I understand?

Correct
Those bars are referred to as "ribbons" in Amibroker.

The ribbons are similar to "Traffic Lights"
Red = no go
Yellow = Caution (prepare to stop) as the position is currently "unloved"
Aqua = Green (good to go)

Skate.
 
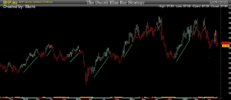
BHP
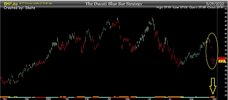
Today the Australian dividend was declared, previously it was in USD & confirmation of AUD was declared today. As I have posted about BHP today I'll post a chart "with one of the indicators " that displays when it was optimal to buy IMHO. Most would hold BHP as a long-term investment for the dividends.


When would you buy & sell BHP as a trader?
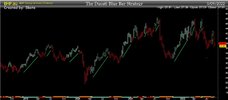
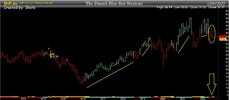
If you wanted to trade BHP instead of investing in BHP the "Ducati Weekly Blue Bar Strategy" would indicate when. You simply buy & sell the coloured bars. Buy the "AQUA Bars" & Sell the "RED Bars". Even if you didn't know anything about trading following the colour of the bars in real-time would have you in front.

Timing the purchase of BHP
Systematic Trend trading is all about capitalising on price movements. Buy when the price is going up & jump off when it isn't. If you had followed the colours (AQUA) bars you would be a winner in this position. The move (the profitable potential) is indicated with the "Green up-sloping lines" for a visual representation.

The"Ducati Weekly Blue Bar Strategy" is not perfect
But you would be tripping over yourself going to the bank. Applying your trading funds elsewhere whilst the bars are red means your funds could be invested more productively than simply buying & holding.

If you were a "Buy & Hold" investor
You would have had to experience the good (price increase) with the bad (price decrease).

Skim BlueBar .jpg

Skate.
 
Thank you, Skate. I've learned something tonight.

Despite the jump in BHP today, it's in the red zone looking at your chart above, but it's only a small ribbon. Does that mean it's less dangerous and a chance will be aqua tomorrow? BHP closed on the day's high, so hopefully there'll be good news tomorrow ........good luck to all holders
 
I've learned something tonight.

Despite the jump in BHP today, it's in the red zone looking at your chart above, but it's only a small ribbon. Does that mean it's less dangerous and a chance will be aqua tomorrow?

I'm just saying
Pick your time to throw a punch. The good thing about trading is that "there are no rules". You can buy anything at any time. Making money consistently takes effort & precision.

I trade systematically
I won't speculate, guess or jump on hunches or gut feelings. To me, trading is pure mathematics. If you go back & look at the previous charts blind Freddy can see the advantages of timing the entry. The analogy of trading is very similar to boxing & it's all about the timing, making those punches count. If you are going to jump into the ring with a professional boxer or professional trader just be fit & ready otherwise you'll be flat on your back in no time.

Read the highlighted parts of your post above
Then look at the charts below & try to determine if it's the time to trade BHP.

If you want to speculate
Or invest in BHP, 3 years from now the timing makes no difference as all you will be doing is splitting hairs.

Trading is different from investing
Trading is just riding the price up, over & over & over & over. As traders, we buy a position in the hope that "sometime in the future" we will be able to offload the position to someone at a "higher price" than when we brought it. Trading is a very emotional experience & emotions can sometimes sabotage the best of plans. In the long run, it will be more profitable to trade the market rather than try to predict it. We as humans are really good at one thing, selecting only the evidence that supports what we want to believe, ultimately leading us to react.

Remember this
"If you can lower your chances of losing your chances of winning can increase.

XAO Daily Percentage Filter
What can I say, other than "trading BHP" on the Daily at the moment is less than ideal. Well, that's my opinion looking at the percentage indicator. Nope, it's not a good period to trade BHP at the moment IMHO.


XAO Daily.jpg


XAO Weekly Percentage Filter
Nope, it's not a good period to trade at the moment IMHO. The percentage filter Indicates it's not ideal to buy at the moment. If you can lower your chances of losing your chances of winning can increase.

XAO Weekly.jpg


XAO Monthly Percentage Filter
Indicates it's not ideal to buy at the moment. If you can lower your chances of losing your chances of winning can increase.

XAO Monthly.jpg


Hang on there
This is a Daily Chart of BHP, that I must say isn't looking all that impressive at the moment

BHP Daily BlueBar .jpg


Hold your horses
This is a Weekly Chart of BHP, & it's not looking like a buy at the moment.

BHP Weekly BlueBar .jpg


Well, blow me down
This is a Monthly Chart of BHP, & it's been out of favour for 3 months now. If I was going to enter on any periodicity I would rather time the entry as a trader. As a speculator, you could buy anytime.

BHP Monthly BlueBar .jpg

In summary
Red, is not my favourite colour.

Skate.
 
The XAO filter is literally just what % of the constituents are up or down over the last week, month etc? or it is more in depth than that? And from reading through the thread, it partly tackles the issue of a general index filter (i.e. as Radge uses) being somewhat lagging and also over-weighted to the bigger companies in the ASX? I have tended to use the general filter in the past so just interesting to see another alternative. Crazy the drawdown Nick is in - think already a couple of his systems that did use some sort of filter are back into OFF mode almost as soon as they were reactivated.
 
to me the thought of the simple index filter in itself, as Nick uses, seemed somewhat prudent and even novel. Now reading around as to why the index filter may not be the best solution and seeing other perspectives feels like taking the next step up the ladder.

Yes, I'm suggesting that there is another way to gauge when the market is buoyant that's not a lagging indicator. If there is 50% or more companies advancing then declining is a crude way to judge if the market or the index is buoyant.

The XAO filter is literally just what % of the constituents are up or down over the last week, month etc? or it is more in depth than that?

Index Filters versus a Buy Filter
The common Index Filter you speak about is a moving average of a nPeriod, the longer the period the bigger the lag. Also, an Index as a whole is not equally weighted. Using the "Percentage Mode" takes that out of the equation.

a general index filter (i.e. as Radge uses) being somewhat lagging and also over-weighted to the bigger companies in the ASX? I have tended to use the general filter in the past so just interesting to see another alternative.

@ArtMaster these are all valid points
It's a common phrase that a "rising tide lifts all boats”. I'm not that convinced that a tide coming in & going out is all that relevant as I'm looking for the market to be buoyant.

Crazy the drawdown Nick is in - think already a couple of his systems that did use some sort of filter are back into OFF mode almost as soon as they were reactivated.

To make money the markets need to be on your side
If the markets aren't kind it doesn't matter how good your system is, the strategy won't perform as expected. The Index Filter you have described may have added to his misery because of the lagging effect but who really knows?

Skate.
 
It's not rocket science
Markets need to be bullish to make any trader look good. If you are a 100% Systematic & Long only trader there has to be a filter in place to limit your trading when the markets are not conducive to your style of trading.

No one has the right to tell anyone how to suck eggs
Let alone tell anyone how to invest their money. I'm just saying when the market changes you need to adapt, doing the same thing over & over & expecting different outcomes borders more on the hope side of trading. Not limiting your drawdown & letting it get out of control is not acceptable in my books.

Skate.
 
I'm just pointing out the obvious
It's usually your strategy or trading style not adjusting to the market condition that usually does the damage to your trading account. I can't imagine how anyone could let their trading account go underwater to the tune of $900k in eight months. Oh, & I don't care about the size of the trading account, that's irrelevant.

There is an old saying
When things go wrong & you find yourself going down into a hole, the first thing you should do is stop digging. Look around long enough to figure out what just happened. Learning to stop digging is an important skill.

Limiting drawdowns
Having a tight & precise exit strategy goes towards keeping your losses in check. A stale exit strategy is another. When it all goes pear-shaped a "get-out-of-jail" card is always handy to have up your sleeve. I refer to that card as my GTFO filter. It's slang for (Get-TheFUCK-Out). Using a combination of these filters "I believe" would have alleviated the stress whilst trading when the markets turn unfavorable.

Skate.
 
Screenshot_20220906-003621.png
Pick your time to throw a punch
Master the 1 inch punch, grasshoppers.
Trade discretionary. ?

It's not rocket science
Markets need to be bullish to make any trader look good.

I would think it's the chosen stocks that need to be bullish to make any old trader look good.
The markets as a whole, need to be mostly dismissed.
:2twocents

Screenshot_20220906-005124.png

 
View attachment 146390

Master the 1 inch punch, grasshoppers.
Trade discretionary. ?


I would think it's the chosen stocks that need to be bullish to make any old trader look good.
The markets as a whole, need to be mostly dismissed.
:2twocents

View attachment 146391


@frugal your post is a good example of adapting to the market conditions. Not so easy for those starting out because you need to have a good selection of tools in your toolbox and know how to use them.
 
@frugal your post is a good example of adapting to the market conditions. Not so easy for those starting out because you need to have a good selection of tools in your toolbox and know how to use them.

Yes, I have to agree
@frugal.rock recent performance is impressive. Trading this year has been tough for some & I'm sure some soul searching is going on with many.

Yes, I am sure converting a percentage that seems reasonable and within the bounds of a reasonable drawdown could become a sobering if not catastrophizing effect on someone by converting it to dollars. Once that is done the person will then begin to think of it in terms of what they could have bought with that money what pleasure they could have had and that will then lead to an unhealthy feeling of loss and even possibly planting the seeds of fear for the future. In other words, setting the trader up with an unhealthy perspective.

Looking at percentages
If you look at your trading results as percentages in isolation you’ll become quickly conditioned & accepting of that percentage. A drawdown of 22.5%, yeah, that's acceptable & let's face it, we have all made the same remark at one stage or another when backtesting. But do you really realise the dollar value of 22.5%?

Percentages are relevant to the size of your portfolio.
A 22.5% drawdown on a $4m trading account is $900k. In reality that's $900k of your trading funds "GONE". Relating a loss in percentage & converting it to dollars is sobering. Converting a percentage drawdown to dollars takes on a new meaning so don't let percentages fool you into a false sense of security. We all tend to accept a 22.5% drawdown in backtesting but could you stomach the dollar value when trading live?

Getting back to breakeven
After a stock market loss, the math of percentages highlights the true damage a loss of 22.5% can do to your portfolio. The returns needed to recover from a loss get more disheartening with the fact that the market tends to drop quickly & move up so slowly. What the math suggests is "that it's better" to protect yourself against losses "before" they get out of control.

Skate.
 
On - Off switch (Weekly XAO)
If you only traded the blue bars you would be making money. The beauty of this strategy it works across all periodicities. The yellow ribbon is saying "Danger Will Robinson, danger" (Lost in Space quote) or for the younger generation it's a "Caution Period".

View attachment 146370


Skate.

BHP
Today the Australian dividend was declared, previously it was in USD & confirmation of AUD was declared today. As I have posted about BHP today I'll post a chart "with one of the indicators " that displays when it was optimal to buy IMHO. Most would hold BHP as a long-term investment for the dividends.


When would you buy & sell BHP as a trader?
If you wanted to trade BHP instead of investing in BHP the "Ducati Weekly Blue Bar Strategy" would indicate when. You simply buy & sell the coloured bars. Buy the "AQUA Bars" & Sell the "RED Bars". Even if you didn't know anything about trading following the colour of the bars in real-time would have you in front.

Timing the purchase of BHP
Systematic Trend trading is all about capitalising on price movements. Buy when the price is going up & jump off when it isn't. If you had followed the colours (AQUA) bars you would be a winner in this position. The move (the profitable potential) is indicated with the "Green up-sloping lines" for a visual representation.

The"Ducati Weekly Blue Bar Strategy" is not perfect
But you would be tripping over yourself going to the bank. Applying your trading funds elsewhere whilst the bars are red means your funds could be invested more productively than simply buying & holding.

If you were a "Buy & Hold" investor
You would have had to experience the good (price increase) with the bad (price decrease).

View attachment 146374

Skate.

@Skate I have marked your chart up for reality, apply a lag to your bars sir, this chart is pretending to know the close in advance when it doesn't.

Why not show the equity curve for these trades? Doesn't match the narrative? Can you actually see the future?

Screenshot_2022-09-06_10-30-32.png
 
Percentages are relevant to the size of your portfolio.
A 22.5% drawdown on a $4m trading account is $900k. In reality that's $900k of your trading funds "GONE". Relating a loss in percentage & converting it to dollars is sobering. Converting a percentage drawdown to dollars takes on a new meaning so don't let percentages fool you into a false sense of security. We all tend to accept a 22.5% drawdown in backtesting but could you stomach the dollar value when trading live?

@Skate this the reason why I have no problem putting a high percentage of my small account at risk when I'm trying out some new things, but this percentage risk is not in my trade plan for the big account.
 
Morning Skate and forum members, I'm working remotely and having a lot of trouble with connection at the moment. Will read the rest of the thread later tonight when I get back to base.

Thank you, Skate for your reply. Cannot disagree with you; what was said makes a lot of sense to me. Thank you for your thoughts and help. Have a great day, and all........
 
@Skate I have marked your chart up for reality, apply a lag to your bars sir, this chart is pretending to know the close in advance when it doesn't.

Why not show the equity curve for these trades? Doesn't match the narrative? Can you actually see the future?

@InsvestoBoy thank you for taking an interest in my posts & for "marking the chart" to fit your narrative. To be perfectly honest we all do the same when replying to others. I try to keep my posts short so others will read them. Making lengthy posts & explaining everything in minute details turns readers off. Unfortunately, this reply post will fall into the latter, being on the lengthy side.

The Chart
The chart of "The Ducati Blue Bar Strategy" was a quick representation in "hindsight" to show how the strategy captures upward price movements, the whole purpose of the exercise, this time around. BTW, the colour of the bar change in real-time during the whole trading period, whether that be Daily, Weekly or Monthly periodicity. This means for me the bars can change every 20-minute intervals no matter the periodicity, meaning the bars can change colour quickly.

A refresher - a simple strategy that uses volatility & volume
I've made multiple posts on the advantages of "The Ducati Blue Bar Strategy" when it comes to a trading strategy that is simple in design & structure as it incorporates (volatility & volume). As traders, we don't need a fancy strategy to make money. It's exciting to experience how other traders & their methodology that decide when a position is to be entered. Coding of the "Blue Bar" strategy is pretty straightforward & it's easy to chart positions to understand the logic behind the selection.

The simplicity of this strategy
"The Ducati Blue Bar Strategy", colours the bars (no matter the periodicity) in real-time telling you what to do next. Put four traders in a room together & they will all have their reason why they "enter & exit" a position. Put four "system traders" in another room & their reasoning behind why they enter a trade can be just as dramatic & diverse.

The Blue Bar Strategy
This strategy has the unique ability to pick the confirmed momentum moves of any security in any time frame. It displays the entry & exit points on the corresponding chart. The first coloured bar is the "signal bar" & the "entry" is at the opening of the next bar no matter the colour.

Skate.
 
Top