Australian (ASX) Stock Market Forum

Dump it Here

Hi all,

For those that were interested in the discussion about short term trading strategies, holding for only a couple of days etc.

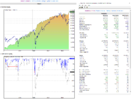
I thought I'd just post an update on the (basic) RSI system that I currently trade on MSFT, its the same one I used in the example.

*** The biggest drawdown is always just around the proverbial corner *** but this last month has finally seen new equity highs in the sytem.

Moving forward if people are interested, I'll post the results of this system whilst I'm still trading it. I'll also show, if / when I stop.

Cheers
1660347829005.png
 
Hi all,

For those that were interested in the discussion about short term trading strategies, holding for only a couple of days etc.

I thought I'd just post an update on the (basic) RSI system that I currently trade on MSFT, its the same one I used in the example.

*** The biggest drawdown is always just around the proverbial corner *** but this last month has finally seen new equity highs in the sytem.

Moving forward if people are interested, I'll post the results of this system whilst I'm still trading it. I'll also show, if / when I stop.

Cheers

View attachment 145347

Willzy, An excellent effort!

I'm interested in any updates and any further info on your methods.

Trading a single major equity like MSFT with such nice results, for me this is remarkable and motivates a little trading guy like me to keep going.
Clearly you have found an inefficiency in the market to confound the EMH theorists!
You have avg profit per trade of $3612, avg loss -$4509 but the secret of you success seems to be the superb 79% win strike rate you achieve without a scary drawdown.
Hi Entropy, just thought I'd pick up on something here that some may not be aware of with Amibroker.

This particular backtest invests all available funds on every trade, thus we see the compounding effect and in order to get a decent view I've used a logarithmic equity plot.

So when you've noticed the avg profit per trade of 3612, and loss of 4589 these figures are distorted by the compounding.

However the average percentage profit and average percentage loss is not.

Thus this backtest shows an accuracy of 78.99% and an average pct win of 1.71% , avg pct loss 1.87%

Amibroker shows a payoff ratio of 3612 / 4589 ==> 0.79
Correct payoff ratio (if all trades were same value ie $100,000) = 1.71 / 1.87 ==> 0.914

This is a subtle difference and for most applications is not that important, however in some instances such as ranking one system against another it can cause issues.

---- here is an example where it can cause problems ---

One of my favorite system metrics is from one of Kevin Davey's books. Its a derivation of expectancy...

Most would know the basic formula for expectancy E = probabilityWin * avgWin - (probabilityLoss) * avgLoss
Now this returns Expecatancy as ( $$$ ) if avgWin is in ( $$$ ) or (percentage) if avgWin is entered as a percentage so its not a unit-less metric.

But if we divide across both sides by avgLoss the formula becomes:

E / avgLoss = Accuracy * avgWin / avgLoss - (1-Accuracy) or
E / avgLoss = Accuracy * payoffRato + Accuracy - 1

Because we are now dividing avgWin by avgLoss our units of measurement be it dollars or pct are cancelled out and we have a unitless measurement.

Kevin has a name for it I cant remember off hand but lets call it normalized expectancy... "e"

e = Accuracy * payoffRato + Accuracy - 1

now if we use Amibrokers original metric of payoffRatio (0.79) then my metric

e = 0.789*0.79 + 0.789 - 1 == 0.412
but it should be
e = 0.789 *0.914 + 0.789 - 1 == 0.510

now if during an optimization we had two systems say one buys when RSI < 20 and another that buys RSI <10 if we dont remove the bias due to compounding from the backtests then our walkForward may select the wrong one...

--- Sorry that turned into a rather long example, hope its not too confusing, please ask if anyone wants more clarification ---
 
Willzy, An excellent effort!

I'm interested in any updates and any further info on your methods.

Trading a single major equity like MSFT with such nice results, for me this is remarkable and motivates a little trading guy like me to keep going.
Clearly you have found an inefficiency in the market to confound the EMH theorists!
You have avg profit per trade of $3612, avg loss -$4509 but the secret of you success seems to be the superb 79% win strike rate you achieve without a scary drawdown.
Sorry forgot to put a thanks at the front of that…

Cheers
 
Hi Entropy, just thought I'd pick up on something here that some may not be aware of with Amibroker.

This particular backtest invests all available funds on every trade, thus we see the compounding effect and in order to get a decent view I've used a logarithmic equity plot.

So when you've noticed the avg profit per trade of 3612, and loss of 4589 these figures are distorted by the compounding.

However the average percentage profit and average percentage loss is not.

Thus this backtest shows an accuracy of 78.99% and an average pct win of 1.71% , avg pct loss 1.87%

Amibroker shows a payoff ratio of 3612 / 4589 ==> 0.79
Correct payoff ratio (if all trades were same value ie $100,000) = 1.71 / 1.87 ==> 0.914

This is a subtle difference and for most applications is not that important, however in some instances such as ranking one system against another it can cause issues.

---- here is an example where it can cause problems ---

One of my favorite system metrics is from one of Kevin Davey's books. Its a derivation of expectancy...

Most would know the basic formula for expectancy E = probabilityWin * avgWin - (probabilityLoss) * avgLoss
Now this returns Expecatancy as ( $$$ ) if avgWin is in ( $$$ ) or (percentage) if avgWin is entered as a percentage so its not a unit-less metric.

But if we divide across both sides by avgLoss the formula becomes:

E / avgLoss = Accuracy * avgWin / avgLoss - (1-Accuracy) or
E / avgLoss = Accuracy * payoffRato + Accuracy - 1

Because we are now dividing avgWin by avgLoss our units of measurement be it dollars or pct are cancelled out and we have a unitless measurement.

Kevin has a name for it I cant remember off hand but lets call it normalized expectancy... "e"

e = Accuracy * payoffRato + Accuracy - 1

now if we use Amibrokers original metric of payoffRatio (0.79) then my metric

e = 0.789*0.79 + 0.789 - 1 == 0.412
but it should be
e = 0.789 *0.914 + 0.789 - 1 == 0.510

now if during an optimization we had two systems say one buys when RSI < 20 and another that buys RSI <10 if we dont remove the bias due to compounding from the backtests then our walkForward may select the wrong one...

--- Sorry that turned into a rather long example, hope its not too confusing, please ask if anyone wants more clarification ---
Absolutely nothing wrong with using compounding for Amibroker backtesting as long as you understand what you are looking at. I've been trying to get this across a few times. @Willzy You obviously don't need to be advised by me however. Excellent post.
 
Hi Entropy, just thought I'd pick up on something here that some may not be aware of with Amibroker.

This particular backtest invests all available funds on every trade, thus we see the compounding effect and in order to get a decent view I've used a logarithmic equity plot.

So when you've noticed the avg profit per trade of 3612, and loss of 4589 these figures are distorted by the compounding.

However the average percentage profit and average percentage loss is not.

Thus this backtest shows an accuracy of 78.99% and an average pct win of 1.71% , avg pct loss 1.87%

Amibroker shows a payoff ratio of 3612 / 4589 ==> 0.79
Correct payoff ratio (if all trades were same value ie $100,000) = 1.71 / 1.87 ==> 0.914

This is a subtle difference and for most applications is not that important, however in some instances such as ranking one system against another it can cause issues.

---- here is an example where it can cause problems ---

One of my favorite system metrics is from one of Kevin Davey's books. Its a derivation of expectancy...

Most would know the basic formula for expectancy E = probabilityWin * avgWin - (probabilityLoss) * avgLoss
Now this returns Expecatancy as ( $$$ ) if avgWin is in ( $$$ ) or (percentage) if avgWin is entered as a percentage so its not a unit-less metric.

But if we divide across both sides by avgLoss the formula becomes:

E / avgLoss = Accuracy * avgWin / avgLoss - (1-Accuracy) or
E / avgLoss = Accuracy * payoffRato + Accuracy - 1

Because we are now dividing avgWin by avgLoss our units of measurement be it dollars or pct are cancelled out and we have a unitless measurement.

Kevin has a name for it I cant remember off hand but lets call it normalized expectancy... "e"

e = Accuracy * payoffRato + Accuracy - 1

now if we use Amibrokers original metric of payoffRatio (0.79) then my metric

e = 0.789*0.79 + 0.789 - 1 == 0.412
but it should be
e = 0.789 *0.914 + 0.789 - 1 == 0.510

now if during an optimization we had two systems say one buys when RSI < 20 and another that buys RSI <10 if we dont remove the bias due to compounding from the backtests then our walkForward may select the wrong one...

--- Sorry that turned into a rather long example, hope its not too confusing, please ask if anyone wants more clarification ---

Willzy, many thanks for the detailed reply and explanation of your metric.

This gives me plenty to work through.

I have been working through Howard Bandy's book "Quantitative Technical Analysis" and I gather he had quite a lot to do with how Amibroker works under the hood.

My interest is to build a trading method with machine learning algorithms using Python guided by some of Dr Bandy's material.
A few hiccups to overcome due to changes within Python since the book was published in 2015.
There is an errata link at Blue Owl Press but my browser warns the link is unsafe and maybe has been hacked.

You wrote:
"now if during an optimization we had two systems say one buys when RSI < 20 and another that buys RSI <10 if we dont remove the bias due to compounding from the backtests then our walkForward may select the wrong one..."

This bit has me puzzled: do you mean that your method switches from one RSI indicator to a different RSI indicator due to some trigger in the market?
 
Thanks for sharing Willzy, very interesting. I notice no transaction costs - how does that impact the results?

cheers
Hi Marty,

Excellent question, I was wondering if someone would pick up on that!

In short, it makes a world of difference. Standard commission rates available in Australia would kill this system and others like it.

There are alternatives though, low comission brokers do exist and it is possible to trade with zero commission.

Other traps to be aware of, if your using CFD's there will inevitably be a SPREAD and SWAP that needs to be put into the calculations.
When I run my backtests for use with CFD's I manually adjust for the SPREAD within the trading logic. ie

BuyPrice = Close * (1 + spread);

Thus it won't show up in the transaction costs of the summary but has been accounted for in the backtest.

I'm not recommending any broker in particular, but ones I have traded with include:

IC-Markets (CFD)
Admiral Markets (CFD)
TradeStation
Interactive Brokers

This type of system requires automation either in the form of a - (Metatrader Expert Advisor) or a (TradeStation easyLanguage Strategy) or an API for interactive brokers.

If anyone is interested I could start a new thread on what I've learnt with these over the last 5-7 years. I also do some freelance work programming Expert Advisors on MT4 and MT5 should anyone like some specific help in that regard.
 
Willzy, many thanks for the detailed reply and explanation of your metric.

This gives me plenty to work through.

I have been working through Howard Bandy's book "Quantitative Technical Analysis" and I gather he had quite a lot to do with how Amibroker works under the hood.

My interest is to build a trading method with machine learning algorithms using Python guided by some of Dr Bandy's material.
A few hiccups to overcome due to changes within Python since the book was published in 2015.
There is an errata link at Blue Owl Press but my browser warns the link is unsafe and maybe has been hacked.

You wrote:
"now if during an optimization we had two systems say one buys when RSI < 20 and another that buys RSI <10 if we dont remove the bias due to compounding from the backtests then our walkForward may select the wrong one..."

This bit has me puzzled: do you mean that your method switches from one RSI indicator to a different RSI indicator due to some trigger in the market?
Hi entropy,

I too get the error with Howard's errata but have continued to it with no issue... that I know of at least...

With regards to this part....

You wrote:
"now if during an optimization we had two systems say one buys when RSI < 20 and another that buys RSI <10 if we dont remove the bias due to compounding from the backtests then our walkForward may select the wrong one..."
This bit has me puzzled: do you mean that your method switches from one RSI indicator to a different RSI indicator due to some trigger in the market?

In short no, I was refering to a basic optimization within amibroker such as RSI(2)<20 for one run vs RSI(2)<10 for another (ie we're optimizing the rsi(2) entry threshold). The compounding effect can give misleading results of some metrics if not accouned for (as discussed with normalised expectancy)

My interest is to build a trading method with machine learning algorithms using Python guided by some of Dr Bandy's material.
A few hiccups to overcome due to changes within Python since the book was published in 2015.


This is an excellent exercise to go through, it'll teach you some python (always a great thing) and the exercise will show the power of machine learning. As with all things though garbage in garbage out... The other biggest trap I would say to be aware of is that ML by its very nature will overfit the data, you need to work out how to work around this. I recomend learning LogisticRegression, TBH its the only one I've had any measurable success with.

Cheers!
 
Hello Skate
Re your post #7300 and the loop processing time, I've noticed several threads in the Amibroker forum where headmaster Tomasz discourages the use of looping, in favour of much faster and efficient array processing commands.

1660465198756.png

If you look at the afl code in the Marsten Parker video I linked to in an earlier post, you will see that he is using the addtocomposite function to aggregate his market breadth filter counts.

Cheers
Joe.
 
Why is the BBO Strategy so frustrating?
We all tend to have our own unique version of John Bollinger's idea & it's at the "very heart" of my "BBO Weekly Strategy". The rules are precisely coded & the idea is robust. Over the longer term, the results aren't too shabby but shorter-term volatility messes with this strategy.

I'm starting to fall into the “what if” scenario
I'm starting to think most who trade this strategy would have to have "nerves of steel" as the results are patchy & there seems to be no happy medium that I've found. When the BBO is working it's on the money but other times it tests your resolve, well it does mine. I'm constantly monitoring my strategies but this one is starting to develop into a full-time job.

The backtest period
From the 1st of January 2022 to today the 18th of August 2022. Anyone trading this strategy would have had a tough 8 months. Red is not my favourite colour.

Just BBO TOP.jpg

In summary, I have a question
Is there anyone actually trading a BBO Strategy?

Skate.
 
Sometimes there is no answer when you can't see the problem
The BBO Strategy should return consistent results, & the volatility bands should be doing all the heavy lifting. Admittedly, signals do lag which really shouldn't be the case. Sometimes the answer can be so simple but I'm missing it at the moment.

Joke
Why did the blind man fall into a well?
Because he didn't see that well.

That level of a joke
Displays my frustration with this strategy

Skate.
 
I'm running a weekly modified BBO strategy on ASX Fully Paid Ordinary universe, and its been bumpy going this year for sure. Nasty DD June/July, lower than usual % winners, lower returns than modelled. Not a fun 12 months, but back in profit at least.

1660820662652.png
 
I tripped over this most excellent contribution (by @tech/a) again a few nights ago. As this is the beginners lounge I thought a re-post here was appropriate.

https://www.aussiestockforums.com/threads/the-best-ive-seen-on-any-forum.864/post-6201

Its a worthwhile read even for the more experienced and hardened traders among us who are suffering from a case of "cant see the forest because there are too many trees".

Read before you go to sleep every night until it sinks in.

Cheers
Joe
 
Hi Skate and system traders

Apologies if this is bit off topic. In system tests using Norgate data has anyone had any success to their systems by adding the stocks' sector strength:
Buy= (my system buy rules) + (and the sector of the stock (GICS classification, real estate, technology etc etc) has ROC(c,10)>x, or above its 200 ema etc etc)

If so, how do you code it?

Thanks
Marty

@martyjames I don't trade anything other than the All ordinaries as a whole. Picking winners as you suggested would be difficult as sometimes they go out of favor as quickly as they come in.

Skate.
 
Top