Australian (ASX) Stock Market Forum

Dump it Here

@martyjames I don't trade anything other than the All ordinaries as a whole. Picking winners as you suggested would be difficult as sometimes they go out of favor as quickly as they come in.

Skate.
@martyjames maybe, but maybe not if you have a longer holding period like in a classic trend following system.
 
Great return @Cam019 & @Newt for this year. I had been running simple BBO as per Nick's Unholy Grails without filter.

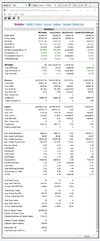
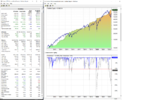
Back test period: 01/01/2022 to 18/08/2022, CAR was -23.44% and Max. system % drawdown -18.52%. Actual traded return for same period was CAR -18% (Filter version, drawdown performed no better).

New BBO version includes tighter stop from bottom band when filter on and this has helped lower drawdown and improve CAR but backtest for this year still red.

@Cam019, is your backtest from "System Building and Idea Testing" thread?

Sid.
 
Back test period: 01/01/2022 to 18/08/2022, CAR was -23.44% and Max. system % drawdown -18.52%. Actual traded return for same period was CAR -18% (Filter version, drawdown performed no better).

I've resisted so far, fiddling with the BBO Strategy
The methodology behind the BBO Strategy is robust & in theory, I shouldn't have to apply too much to make this strategy perform, but that's not the case. Bollinger Bands attempt to overcome the problems associated with trading envelopes as it combines the measurement of volatility (standard deviation) with a moving average. There are a set of two variable width trading bands (upper & Lower) that would automatically adapt to the volatility of the market. My question is, if this is so why don't the bands do all the lifting?

Caution to the wind
Heck, the BBO Strategy that I have in its standard form isn't worth the commission to have a go. Admittedly I've added a bit of lipstick (even though I shouldn't have with a strategy using volatility bands) but alas it was necessary. Adding an alternative buy condition with optimized parameters & filters, it started to grow an extra leg.

#1 Backtest updates
Backtest from - 1/1/2018 to today

3. BBO % Jan 2018 to today.jpg


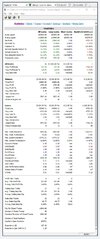
#2. Backtest updates
A 365-day Backtest from 18/8/2021 to today (one calendar year)

365 Days. BBO % Top.jpg


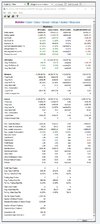
#3. Backtest updates
1/1/2022 to today (The first 8 months of this calendar year)

1. BBO % Jan to today Top.jpg

Skate.
 
BBO.jpg

Bollinger Band Background, for those who don't know
Bollinger Bands are a technical indicator developed by John Bollinger. The indicator forms a channel around the price movement. The channels are based on standard deviations of a moving average. Bollinger bands can help you establish a trend's direction, spot potential reversals & importantly monitor volatility. All of this can help you make better trading decisions if you follow a few simple guidelines.

Bollinger Band Basics
Bollinger bands have three lines, upper, middle & lower. The middle line is a moving average of prices. The parameters of the moving average (the lookback period) are chosen by the coder. There is "no magic moving average number", so it's important that the moving average (the middle line) aligns with the techniques & strategy being traded. The upper and lower bands are drawn on either side of the moving average. The distance between the upper and lower band is determined by standard deviations. You can use the (HIGH price), the (CLOSING price), or any other variation you can think of, it is all up to you to decide.

Skate.
 
Hi Skate and system traders

Apologies if this is bit off topic. In system tests using Norgate data has anyone had any success to their systems by adding the stocks' sector strength:
Buy= (my system buy rules) + (and the sector of the stock (GICS classification, real estate, technology etc etc) has ROC(c,10)>x, or above its 200 ema etc etc)

If so, how do you code it?

Thanks
Marty
I can't comment on its effectiveness, but here is how you code it:

 
I did it in another way but did not manage to find a great edge due to the fact norgate data has a quite vague and wide sector definition.
I get that not many people here may be interested in small caps, but...

If anyone reading this knows Python and web scraping, and can give me some hints on scraping scraping this site:


and the other sectors, please PM me. I have scraped other sites, just having issues with this one. BTW, you need to view frame source, not view page source.

Likewise, if there is a better source for stocks in a given sector, that is updated on a regular basis, please let me know.
Interesting, obviously was talking about asx sector as defined in nortgate data, a dozen or so with not difference between a oil explorer or caltex, and mining can be gold mine, lithium or coal.
Doing your own sectorisation is a nice move @Linus van Pelt
Well done
 
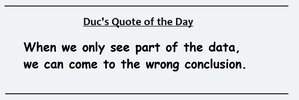
QOTD.jpg

This was part of @ducati916 post today
This goes a long way in explaining why our trading success (win rate) is no better than a coin toss.

Sam Savage provides a great example of this in "The Flaw of Averages"
"An example concerns the statistician who drowned while fording a river that was, on average, only three feet deep". In this case, knowing the distribution of the river's depth or the (maximum depth) would have been far superior than knowing only the average depth.

Another common way in which data can be misleading is when that data is derived from a process that "changes over time". Anytime the underlying mechanism that creates a data series changes, "patterns tend to break down".


Skate.
 
Hello Skate
Re your post #7300 and the loop processing time, I've noticed several threads in the Amibroker forum where headmaster Tomasz discourages the use of looping, in favour of much faster and efficient array processing commands.

View attachment 145426

If you look at the afl code in the Marsten Parker video I linked to in an earlier post, you will see that he is using the addtocomposite function to aggregate his market breadth filter counts.

Cheers
Joe.

Slow execution of the "Percentage Filter" due to the heavy looping
@Joe90, just a quick update. The irritation of a slow execution of a Backtest & Exploration Analysis issue has been overcome by saving the variables to "staticVars", retrieving them in the rest of the formula so they execute only ONCE.

Backtest ORIGINAL execution time.jpg

# Updated "Skate's WTT Percentage Filter Strategy"
Backtest execution time.jpg

Skate.
 
What do EC, EP, CX, CXXT, & NXXT transaction codes mean?
There are times when transactions can occur outside the auction opening hours. The action is referenced without an explanation. Below is a quick explanation of what the abbreviations mean. (posted for a searchable reference)

EP = exercise of a put option
If an investor owns shares of stock & owns a put option, the option is exercised when the stock price falls below the strike price. Instead of exercising an option that's profitable, an investor can sell the option contract back to the market & pocket the gain.

EC = exercise of a call option
When you exercise a call option, you would buy the underlying shares at the specified strike price before the expiration. Compare the strike price of the call option to the current stock price.

CX & CXXT = is a cross trade
A cross trade is a trade that has occurred in ASX CentrePoint at the current midpoint price. The midpoint price is determined by ASX to be the midpoint between the current ASX bid/offer spread.

XT & NXXT = is also a cross trade
A cross trade occurs when a broker executes an order to buy & sell the same security at the same time, in which both the buyer & seller are clients of the broker. A cross trade is represented by XT in the course of sales. If your order has been cross traded, your contract note will state this. NXXT is a type of crossing or crossed trade that your broker reports to the ASX. An NXXT is a crossing that has occurred at the current NBBO Price (known as an “NBBO Crossing”).

NBBO = National Best Bid & Offer Prices
The national best bid price is the highest price that all buyers are willing to pay for a particular stock, regardless of what trading venue it is being published on. Similarly, the national best offer price is the lowest price that all sellers are willing to accept for a particular stock. This type of trade typically occurs when your broker has managed to automatically match your order with another client's order through the Crossing System.

Skate.
 
Hi everyone,

Inspiration struck me this week. I was reading through a book I’ve read in the past by Larry Connors – High Probability ETF Trading. I’m sure many are familiar with his work, if not I highly suggest a google search for his books. I came across one of his strategies “Connors TPS – (time price & scale)” which I had previously tried to code in Amibroker. It was years ago and my coding skills weren’t the greatest. Today they are still are a work in progress, but with a bit of work this week I think I’ve been able to crack it and thought I’d share my results.

The book has been published since 2009 and so I hope I’m not breaking any copyright by posting them here but honestly a quick google search will find the rules:
  • Stock must be above 200 day SMA
  • RSI(2) < 25 for two consecutive days
  • 1st entry 10% of total funds dedicated to this system
  • 2nd entry if price closes below 1st entry and stock still above SMA buy 20%
  • 3rd entry is same rules but buy 30%
  • 4th entry same but buy further 40% - taking total position size up to 100%
  • Sell all shares any time RSI(2) > 70
All trades are taken at the close of the market – difficult to achieve without good tools – ie automation.
Short side is the reverse logic.

I first of all tested the strategy one symbol at a time, starting with ones I know work well with mean reversion – ( please note that there is a dangerous “SELECTION” bias here as I have already identified several symbols I like to trade in this way because they have proven to me they have a tradeable MR signal ( MSFT, V, MA, FISV, QQQ, SPYG, XLK to name a few ).

This was a simple viability test and given the system was published in 2009 I was pleasantly surprised with the results.

MSFT, ADBE and QQQ stood out. The only change I made to the rules was to trade LONG only and remove the 200day SMA – though I’ve left it in the amibroker afl. The other thing to mention is that the profit was quite low and in order to make it tradeable I coded in a Leverage of 2:1 so in reality you’d need CFD’s or a margin account.

I’m not sure if this way of trading is better than my current BASIC RSI system and so I’m now in the process of coding a MT5 Expert Advisor (trading bot) to test this trading style on a demo account for a few months. I’m a big believer of Beta testing, one to test the system and two to make sure I’ve got no bugs in my MQL code.

As with all mean reversion systems, it’s the stairs up and the elevator down… anyone running this make sure to test it on some other instruments to see what can happen if the stock tanks! Ouch …

That being said, I’m yet to find a system, trend following or otherwise which doesn’t have nasty drawdowns, they just seem a bit slower I guess…

I’ve attached the Amibroker .afl code I put together, please feel free to play with, dissect and critique so we can all learn!

I’ll follow up with the MT5 demo results and if they’re any good I’ll make the EA’s available on the MQL store.

I've already coded it in TradeStation EasyLanguage so if anyone wants the code for that - its like 20 lines just message me and I'll provide a copy

Cheers


C++:
//==================================
//     ConnorsTPS Long Only         ===
//     AFL By Willzy                 ===
//==================================

//     --- BackTest Settings --- //

// Set Trading Costs
SetOption("CommissionMode", 2); // Fixed $/Trade
SetOption("CommissionAmount",2); // $2 Commission
Spread = 0.0020; // Spread = 0.2% - may need adjustment based on instrument being traded               

// Account Finance Settings
SetOption("InterestRate",0);
SetOption("MarginRequirement",10); // Set For CFD type trading

// Trade Logic Settings
SetOption("AllowSameBarExit",False);
SetOption("ActivateStopsImmediately",False);
SetOption("AllowPositionShrinking",True);
SetOption("PriceBoundChecking",True);
SetOption("ReverseSignalForcesExit",False);
SetOption("UsePrevBarEquityForPosSizing",False);
SetOption("DisableRuinStop", True);

// --- Custom Functions --- //

// --- Backtest Method --- //
SetOption( "PortfolioReportMode", 0 );
SetOption("NoDefaultColumns",False);
SetOption("ExtraColumnsLocation", 1 );

// --- Monte Carlo Settings --- //
SetOption( "MCEnable", 2 );
SetOption( "MCRuns", 1000 );
SetOption( "MCStrawBroomLines", 10 );
SetOption( "MCNegativeDrawdown", 0 );
SetOption( "MCChartEquityScale", 0 );
SetOption( "MCUseEquityChanges", 0 );

// --- Position Sizing --- //
nPos = 1;
Leverage = 2;


SetOption( "InitialEquity", 10000 );
SetOption( "MaxOpenPositions", nPos );

// --- Variables and Parameters --- //
// Set maximum number of scale in trades - (original TPS logic - 1 2 3 4 )
maxScaleIn = 4;

// Indicator variables
maPeriod = 200;
rsiPeriod = 2;
rsiEntryLimit = 25;
rsiExitLimit = 70;

// --- Calcualte Indicators --- //
rsiIndicator = RSI(rsiPeriod);
SMA = MA(Close,maPeriod);

// --- Trading System Logic --- //
upTrend = 1;//C>MA(C,maPeriod);
buySignal = upTrend AND rsiIndicator < rsiEntryLimit AND Ref(rsiIndicator,-1) < rsiEntryLimit;
entryLong = buySignal;
entryPrice = Close * (1 + Spread);

sellSignal = rsiIndicator > rsiExitLimit;
exitLong = sellSignal;
exitPrice = Close;

// --- Combine Entries Exits and Stops --- //
Buy = Sell = Short = Cover = 0;
BuyPrice = entryPrice;
SellPrice = exitPrice;

// Initialize Arrays
PositionArray = Null;
LastEntryPriceArray = Null;
nBar = Null;

// Loop over all bars
for( i = 1; i < BarCount; i++ ){   
    if( EntryLong[i] ) // if entry signal on this bar
    {
        Position = PositionArray[i] = 1;
        lastEntryPrice = lastEntryPriceArray[i] = BuyPrice[i];
        
        for( j = i; j < BarCount; j++ ) // step forward one bar at a time to process the trade
        {
            // Remove Excess buySignals Until Exit is activated and i == j
            nBar[j] = j - i;
            if( nBar[j] > 0 )
            {
                buySignal[j] = 0;
                entryLong[j] = 0;
            
                // Check for ScaleIn First
                if( upTrend[j] == 1 && Close[j] < lastEntryPrice && Position < maxScaleIn )
                {
                    Position += 1;
                    PositionArray[j] = Position;
                    lastEntryPrice = BuyPrice[j];
                    lastEntryPriceArray[j] = lastEntryPrice;                   
                    continue;
                }
                
                lastEntryPriceArray[j] = lastEntryPriceArray[j-1];
                PositionArray[j] = PositionArray[j-1];           
                
                // If Exit Signal Sell on Current Bar
                if( ExitLong[j] )
                {
                    lastEntryPrice = lastEntryPriceArray[j] = Null;
                    Position = 0;
                    Sell[j] = 1;
                    i = j;
                    break;
                }               
            }
            
            // If No Exit Detected
            else
                if( j == BarCount - 1 )
                {
                    i = j;
                    break;
                }
        }
    }
}

takeAction = PositionArray > Ref(PositionArray,-1);
Buy = IIf((PositionArray == 1 AND takeAction), 1, IIf(takeAction, sigScaleIn, 0 ));

// Set Position Sizing here because it requries PositionArray input as variable
SetPositionSize( Leverage * PositionArray * 10, spsPercentOfEquity );

// --- Create Figures and Plots --- //

// Plot Price
PlotOHLC( O, H, L, C, "Price", colorBlack, styleBar );

// Plot Indicators
Plot(MA(Close,maPeriod),"SMA",colorBlue,styleLine);

//Plot Entry Exit and Setup Signals
PlotShapes( IIf( Buy == 1, shapeHollowCircle, IIf(Buy > 1 , shapeHollowCircle, shapeNone )), colorGreen, 0, BuyPrice, 0 );
PlotShapes( IIf( Sell == 1, shapeHollowCircle, shapeNone ), colorRed, 0 , SellPrice, 0 );

FirstVisibleBar = Status( "FirstVisibleBar" );
Lastvisiblebar = Status( "LastVisibleBar" );

for( b = Firstvisiblebar; b <= Lastvisiblebar AND b < BarCount; b++ ){
    if( Buy[b] ){
        PlotText( NumToStr( PositionArray[b], 2 ), b, Low[b]*0.99, colorBlack );
    }

    //if( Sell[b] ){
    //    PlotText( "Exit", b, SellPrice[b], colorBlue );
    //}
}

// --- END --- //

// --- Create Explore Filter for Error Checking --- //
Filter = 1;
AddColumn( Close, "Close", 1.2, IIf( C<Ref(C,-1), colorRed, colorGreen ) );
AddColumn( buySignal, "BuySig", 1 );
AddColumn( entryLong, "EntryLong", 1 );
AddColumn( PositionSize, "PosSize", 1 );
AddColumn( nBar, "nBar", 1 );
AddColumn( positionArray, "PositionArray", 1 );
AddColumn( lastEntryPriceArray, "lastEntryPriceArray", 1.2 );
AddColumn( sellSignal, "SellSig", 1 );
AddColumn( exitLong, "ExitLong", 1 );
 

Attachments

  • msft connorsTPS long only no SMA.png
    msft connorsTPS long only no SMA.png
    695.4 KB · Views: 47
  • qqq TPS chart.png
    qqq TPS chart.png
    187.5 KB · Views: 44
You don't need skills to be a profitable trader
"You need luck", otherwise one reputable trader wouldn't be down (-$907,295) in 7 months. When your luck is out, it's out. Trading when the market is clearly unfavourable for a 100% long-only systematic trader is a quick way to go broke. System traders backtest their strategies to an inch of their lives & tend to rely heavily on those results. I don't care how good your system is because it won't perform when the markets aren't. When the markets are bullish all system traders look better than they actually are.

We all think backtesting is a secret weapon in trading
Throw up a backtest over many years & being positive most years doesn't automatically translate into being a profitable strategy to trade. All backtests seem to work most of the time because backtesting is built around randomness. Chance, luck, randomness whatever you want to call it shouldn't be ignored as some strategies will show good returns simply by chance.

Skate.
 
Unpredictable events drive the markets
Markets constantly change & no backtest can accommodate for this as the future is unpredictable. Random events shape the direction of the markets & you can never backtest for such things. Quantifying a trading strategy is harder than you think because backtesting relies on knowing the past & it's this very reason we use the parameters that we do, to enhance the results.

A simple strategy will most likely stand the test of time
"Simple works" works in system trading because there is less to go wrong. If you can accept that live trading will never be as good as your backtest results & at times even worse you will be halfway to being a half-decent trader. It’s easy to make coding mistakes that can affect the accuracy of the backtest results. If the backtest results are exceptional the code is likely flawed. Trading a flawed strategy will damage your account quickly.

Skate.
 
All traders exhibit a degree of behavioral mistakes
The psychological aspect of trading is just as important as the strategy itself because if you can't handle drawdowns & continue trading the strategy all the development work will be for naught. The first question any new system trader should ask themselves is this, "can I actually follow the strategy religiously?"

It takes time to find out what works
Anyone can (fine-tune) or fiddle with a strategy until the returns are brilliant but I doubt it will make money going forward. It's worth remembering, that your testing methodology is an important step in the development phase.

Skate.
 
Backtesting can limit your risk
If you can lower your chances of losing your chances of winning can increase. Backtesting is all about finding buying opportunities that work giving you the confidence to trade the strategy in the future. But, here's the rub, If the backtest results aren’t positive straight away we tend to "fiddle & tweak" the strategy until it performs perfectly before ditching it altogether.

This is where most system traders go wrong
Electronic backtesting has its limitations & at times very untrustworthy. The only backtest to take any notice of is a "physical backtest". Physical backtesting is called "paper trading". When it passes the physical (paper trading) it's only then you are good to trade.

Skate.
 
Skate, why can't there be an indicator in a system that identifies when the conditions that the system was designed for are present and turn the system 'on' when they are there and 'off' when they aren't?

Well, @DaveTrade that's a big ask as nothing works perfectly.

Working with unknown data is the issue
Looking at a chart in retrospect it's easy to pick the optimal trading period but when we trade only the right-hand side of the chart in real-time it becomes a little more difficult to pick these points or trading periods.

There are a few though
First off, we need to be conditioned to trade only when the optimal periods have been established.

The next is timing
Timing when to enter & when to exit. Those who buy & hold, simply ride the fluctuations without complaint. But to make serious money you need to ride the waves with precision with means to the best of your ability

Skate.
 
turn the system 'on' when they are and 'off' when they aren't?

Sure that sounds reasonable
But doing as you have suggested is a great idea "but it limits" your profitability. A better way is to know when the system is "on" & only jump in when it is optimal to do so.

There is a big "C" word to consider "Confirmation"
As a systematic trend trader, timing is the keyword. "Confirmation" of a trend is the first critical part of the puzzle as not all trends are of the same value. To make serious money, timing the exit depends on "Confirmation". Waiting for confirmation can either keep you in the trade to squeeze the most out or it can lose a little for this confirmation to complete. Trading is always a trade-off.

Skate.
 
Top