Australian (ASX) Stock Market Forum

Dump it Here

Mate, R U OK?
The market is jumping. Stocks with no names are catching a bid. Even @frugal.rock 's barcodes are moving. Anything with a smell of lithium is going up. I'm currently looking for pegmatites in the backyard. All kinds of animals are appearing in the market, flying bats, blue wrens, pandas and many hybrids of all shapes and sizes. Your ROC indicator must have gone bonkers during the last few weeks indicating hundreds of new opportunities. The Combo portfolio is fully invested and there's still plenty more opps. Wow, was that a kingfisher zipping past my ear to grab that new entry that just popped up!

Edit: You can PM me if you just want to vent on any topic.

lucy.PNG
 
Mate, R U OK?

Yes @peter2, I'm okay. It's been a busy time for me, allowing less time on the thread.

Trading has been going okay for me
I assume it's been the same for everyone else. After reading a few posts it appears not to be the case. No matter what they say, there is always someone making money. I mentioned earlier in the thread that I was starting new strategies at the start of the new financial year. I have already started two of the three strategies & both are traveling along nicely "at the moment".

On Monday I'll be starting the third
I've been looking for another simple strategy to trade & there is no simpler idea than a Bollinger Band Breakout Strategy. I have applied additional knowledge I’ve gained over the years to some of my earlier work. Surprisingly the new upgraded version of the BBO strategy isn’t too shabby at all. Having a few extra dollars to invest is a strong motivator to revisit this strategy.

Skate.
 
Is it possible to re-run you code and report the backtest results for say the approx five years only 2018 to 2022?
I am interested to see how the more recent data pans out.

Published on the 20th July 2021
"One of the most popular strategies was the Bollinger Band Breakout (BBO) strategy named “One of the Top 10 Trading Systems of All Time” by Futures Truth and remains a popular trend following strategy".

Disclaimer
The backtest results are from my version of the "Weekly Bollinger Band Breakout Strategy". The results aren't too shabby & the drawdown is lower than most trend trading strategies as I incorporate the Bollinger Bands as an additional exit strategy. We all tend to have our own unique version of John Bollinger's idea & it's at the "very heart" of my "BBO Strategy". Many will trade a variation of the BBO strategy because it's a trusted workhorse that works across all time periods. The BBO is a brilliant idea of John Bollinger.

So there is no cherry-picking
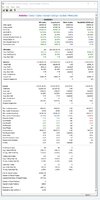
All backtest going forward will be on the dates suggested by @entropy. The backtest period is from 1/1/2018 to today.

BBO TOP.jpg

Skate.
 
Published on the 20th July 2021
"One of the most popular strategies was the Bollinger Band Breakout (BBO) strategy named “One of the Top 10 Trading Systems of All Time” by Futures Truth and remains a popular trend following strategy".

Disclaimer
The backtest results are from my version of the "Weekly Bollinger Band Breakout Strategy". The results aren't too shabby & the drawdown is lower than most trend trading strategies as I incorporate the Bollinger Bands as an additional exit strategy. We all tend to have our own unique version of John Bollinger's idea & it's at the "very heart" of my "BBO Strategy". Many will trade a variation of the BBO strategy because it's a trusted workhorse that works across all time periods. The BBO is a brilliant idea of John Bollinger.

So there is no cherry-picking
All backtest going forward will be on the dates suggested by @entropy. The backtest period is from 1/1/2018 to today.

View attachment 145182

Skate.
Hum, i should look back at my old bb strategy, got a bit more knowledge under the belly, and the previous version was run/tested on corrupt data.
I hope i will have the time to review that indeed
 
I mentioned earlier in the thread that I was starting new strategies at the start of the new financial year. I have already started two of the three strategies & both are traveling along nicely "at the moment".

For those interested
Time Stamp 1:55 pm Today 10th August 2022

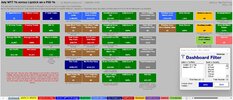
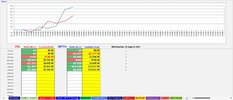
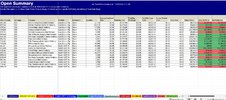
WTT% Strategy (10 x $10k positions)
The WTT% uses the number of advancing positions in the relationship of decliners converted to a percentage as an alternative to using a simple moving average index filter. The issue I have using the garden variety (SMA) index filter is the tremendous amount of lag. This lag guarantees you will get in & out of a position late. I believe my alternative overcomes this issue.

"Skate's Lipstick on a Pig Strategy" (10 x $10k positions)
First off, I should say @Newt's accidentally named this strategy "Lipstick on a pig". In a previous post, I was saying, "vanilla" strategies can be improved. These improvements, using additional buy conditions, parameters, & indicators, are the "Lipstick on the pig" he was referring to.


July Start.jpg


July Equity Start.jpg


July Open Summary Start.jpg


Skate.
 
The issue I have using the garden variety (SMA) index filter is the tremendous amount of lag. This lag guarantees you will get in & out of a position late.
Yep, totally agree that this lag is huge, especially after a panic dip in the market. The only purpose of a off/on market filter is to reduce the max DD. Once this has been activated and reduced the DD compared to the market, the portfolio manager needs to get back into the market quickly in order to take advantage of any rally. Moving averages and even volatility based indicators have too much lag for me after panic selloffs.
 
Technical Analysis Explained
In this YouTube video, Owen Rask interviews Nick Radge from The Chartist about his style of trading using technical analysis. The interview is well suited for those just starting out who are interested in system trading

Halfway through the interview, Owen asks two important questions
1. If you were getting started in technical analysis today, which resources would you use to learn?
2. Where do most technical analysts go wrong?


Skate.
 
For those interested
Time Stamp 1:55 pm Today 10th August 2022

WTT% Strategy (10 x $10k positions)
The WTT% uses the number of advancing positions in the relationship of decliners converted to a percentage as an alternative to using a simple moving average index filter. The issue I have using the garden variety (SMA) index filter is the tremendous amount of lag. This lag guarantees you will get in & out of a position late. I believe my alternative overcomes this issue.

"Skate's Lipstick on a Pig Strategy" (10 x $10k positions)
First off, I should say @Newt's accidentally named this strategy "Lipstick on a pig". In a previous post, I was saying, "vanilla" strategies can be improved. These improvements, using additional buy conditions, parameters, & indicators, are the "Lipstick on the pig" he was referring to.


View attachment 145183


View attachment 145184


View attachment 145186


Skate.

Nice set of trades there, Skate, well done!

Especially since you are adapting some long-established methods: I would have thought that the juice would be all squeezed out of those oranges so it is encouraging to me as a newby that the old ideas are worth re-investigating.
Amongst the noise you have detected some strong signals!

Your point about looking for signals other than ones like SMA's, which can be by their nature quite lagging, is a good one.

Do you consider it useful to pay attention to indices as an overall filter?
By that I mean if a candidate stock is in a sector whose index is flat or falling do you avoid it?
Say the index for all industrials in the All Ordinaries is declining would you automatically avoid these stocks until they move to an uptrend?

@entropy thanks for taking an interest in my way of trading.

We all tend to have our own way of trading
Before replying to your questions directly let me make a few points. Being a systematic trend trader I only have one job to do, which is to follow the buy & sell signals that are generated by my systems. It's even easier when "Position Sizing & Position Score" is part of the mix.

It's a business market
There are so many retirees being forced to look for better returns in their retirement, I was one of them back in 2015. The only option for me was to have a go at "trading" the stock market. Early on it was so confusing because I knew nothing about the stock market till the penny dropped. The stock market should be called the "Business Market" a place where you buy & sell small parts of a business.

Being a fact & figure guy
Using technical analysis made more sense to me because the alternative "fundamental analysis" was time-consuming trying to decipher old data that is usually presented in such a way to shine only the brightest light on the company.

Your question
1. Do you consider it useful to pay attention to indices as an overall filter? - NO
(a) I'm a basic trader (b) I trade the ASX All Ordinaries (c) I trade multiple Mechanical Trend Trading Strategies (d) I trade the ideas of others, as there is no reason to reinvent the wheel (e) I spend most of my time trying to improve on those ideas.

Skate.
 
When others know you actually trade you get asked a lot of questions
Over the years the majority of questions can be summed into one - How do you know what stock to buy?

Trading is simple & uncomplicated
Don't let anyone tell you it's not. It's not rocket science to buy & sell part of a company. The difficult part is finding (a) what to buy (b) when to buy it & most of all (c) when to sell it.

The market & individual stocks go up & down with such regularity
Jumping on when they are going up & hopping off at the first sign of them going down is where the skill is. With system trading, it's easy to mathematically code these precise conditions, add money management to the mix & you're good to go.

Skate.
 
Nice set of trades there, Skate, well done!

Especially since you are adapting some long-established methods: I would have thought that the juice would be all squeezed out of those oranges so it is encouraging to me as a newby that the old ideas are worth re-investigating.
Amongst the noise you have detected some strong signals!

Your point about looking for signals other than ones like SMA's, which can be by their nature quite lagging, is a good one.

Do you consider it useful to pay attention to indices as an overall filter?
By that I mean if a candidate stock is in a sector whose index is flat or falling do you avoid it?
Say the index for all industrials in the All Ordinaries is declining would you automatically avoid these stocks until they move to an uptrend?
Fwiw, i tried such a system looking at trend per sector something initially qfsec in my journal.
To systematic traders like us, the issue is that the available sector definition is not precise enough via nortgate data for example bad luck if you want to target copper, or lithium, you will find mining, energy, it,etc but not much more.
Too vague in my opinion..from memory 10 or 11sectors for the xao
And the pure sector system that qfsec was , has morphed into a general trending system with wide whole sector areas weights in the ranking.

So a touch of sector preferences but not more to get some edge
Would be a different matter if you have a discretionary approach, such as @peter2 .and you can take then a finer approach....
 
Fwiw, i tried such a system looking at trend per sector something initially qfsec in my journal.

Trade anything going up
That statement should be with a proviso. Buy only positions that are going up that meet precise conditions & sell them when precise conditions are met. The strategy will find those positions no matter the sector.

(a) I'm a basic trader (b) I trade the ASX All Ordinaries (c) I trade multiple Mechanical Trend Trading Strategies (d) I trade the ideas of others, as there is no reason to reinvent the wheel (e) I spend most of my time trying to improve on those ideas.

Improving on an original idea
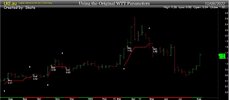
(LKE) has been mentioned on Twitter & in this thread so I'll use that as the example to demonstrate an improvement IMHO. The WTT strategy is a simple 20-period breakout. The original WTT strategy produces the buy & sell signals shown on the chart. The next chart is my recoding to take advantage of the exit. To reiterate, the exit is the money maker.

WTT - LKE.jpg


Being more selective
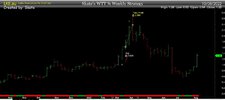
Strategy signals are generated when precise conditions are met. Being more selective makes sense when stronger signals are coming along at a great rate of knots.


WTT % - LKE.jpg


I use a variety of buy filters
Earlier I discussed that a garden variety "Index Filter" using a simple moving average is robust but the lag can play havoc with your strategy returns. It's worth remembering that there is always someone making money even if you are not.

Index Filter versus a Buy Filter (the coloured ribbon)
A simple moving average to keep you on the right side of the market is better than having none at all. The "WTT% Strategy" incorporates a simple buy filter. If 50% of the companies in the "All Ordinaries" is up over a week, it indicates "to me" it's safe to buy. Using the percentage method treats all companies "as equals" rather than being weighted by the top few. The "green" colour of the ribbon at the bottom of the chart denotes when it's safe to take a position.

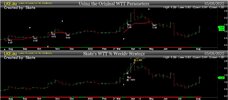
The upper & lower chart
In the upper chart, the original WTT strategy depends on a simple moving average to determine when a position can be taken, whereas the lower chart depends on the percentage value of all companies in the "All Ordinaries" to make that decision.

LKE.jpg

Summary
There is no reason to reinvent the wheel. I spend most of my time trying to improve the wheel, otherwise, we would still be using the wheels that were used on wagon trains all those years ago.

Skate.
 
A simple moving average to keep you on the right side of the market is better than having none at all. The "WTT% Strategy" incorporates a simple buy filter. If 50% of the companies in the "All Ordinaries" is up over a week, it indicates "to me" it's safe to buy.

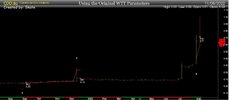
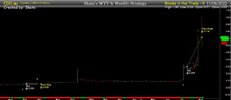
A more recent example (ASX:CDD)
In the original strategy, there were two positions taken. (1) The first just went sideways for around 18 weeks, tying up money that could have been put to better use. (2) Entering the second position using an (SMA) Index Filter "ensured" you entered late.

CDD WTT Original.jpg


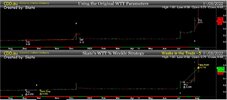
In the WTT % Strategy
There were also two positions taken. (1) The first entry went stale very quickly. Exiting this "stale" position means the money can be put to better use, investing it elsewhere. (2) Entering the second position using a "Buy Filter" that's dependent on the percentage of advancing stock compared to declining stock "ensured you didn't enter" the position late.

CDD WTT %.jpg


Direct comparison
Comparing the signals on the charts should paint a thousand words.

CDD WTT Original versus WTT%.jpg

Skate.
 
Hi Skate - just getting my head around the filters mentioned above. I did join the Chartist a year or so ago, has not been particularly fruitful since the majority of the trend systems have been off for a while but I have enjoyed reading/watching some of Nick's educational content. He is certainly a level head and in terms of the psychology aspect there is plenty to take from him. I am not particularly for/against his systems as a whole. Saw some of the results and the ease of the momentum systems and possibly jumped the gun a little, I would imagine that is a fairly common theme with his subscribers. Possibly a little 'green' and something which appears profitable and relatively straightforward holds instant appeal. I do find the turnkey thing a little strange - selling a code but then using a modified version of this seems a little off particularly those who are buying it but without the necessary coding knowledge to make their own modifications, should those types of people exist. Maybe only those with coding knowledge to begin with would be advised to purchase but that of course raises the question of why such people would need it to begin with if they could just code a version for themselves as you have done yourself. He seems to have his own personal systems on top of the ones he sells so does become a little muddy to keep track of it all.

Anyway, back to the filters - was just intrigued how to referred to it as a 'Buy' signal. Is that to say that the red periods are not necessarily looked upon as 'sell' ones (apologies if I have missed this over the past few pages). I know with Nick's he starts with a farily large stop loss which moves up to 10% as soon as the filter turns on. I can see that yours is 'off' a lot more of the time in comparision but with the benefit of reducing the off/on lag from what I can tell. I am clearly much more of a noob with all this than many in here so its something of an eye opener - to me the thought of the simple index filter in itself, as Nick uses, seemed somewhat prudent and even novel. Now reading around as to why the index filter may not be the best solution and seeing other perspectives feels like taking the next step up the ladder. Certainly there is no free lunch with these things and always more to consider.
 
something which appears profitable and relatively straightforward holds instant appeal.

Hi @ArtMaster, thank you for making your first post in this thread. It's half-time in the NRL so I'll quickly respond.

When others express their opinion
It makes others think about their own. Admittedly, trading has been difficult but you can take this to the bank "there are others still going okay".

Before you buy anything just remember
When others have something to sell, they will only sell the good points. Every good salesman knows "perception equals reaction". If the reaction you are after is a sale, all you have to do is set the correct perception, it's that easy.

I do find the turnkey thing a little strange - selling a code but then using a modified version of this seems a little off particularly those who are buying it but without the necessary coding knowledge to make their own modifications

I have mentioned before that "no one sells a good racehorse"
But with any racehorse, with a little time & effort, a good trainer can lift a racehorse if improvements to be found, even a dead racehorse has some value. I'll do a post on this in the next post.

Anyway, back to the filters - was just intrigued how to referred to it as a 'Buy' signal. Is that to say that the red periods are not necessarily looked upon as 'sell' ones (apologies if I have missed this over the past few pages). I know with Nick's he starts with a farily large stop loss which moves up to 10% as soon as the filter turns on.

Deciding what to buy & when is important
But timing when to sell is critical. Sell too early or too late & even the best buys turn quickly into duds. We all have our own unique ways of trading & I'm no different. Just because someone uses an index filter with a wide initial stop only to shorten it up when the index filter turns off is one way of doing it.

I prefer to do it a little differently
I use buy filters, a take profit stop, a stale stop exit, as well as a simple trailing stop that is variable. Search any of those keywords to understand each a little better. Also, look at the recent charts for a comparison between trading methods. Check out the signals between the "original WTT versus Skate's WTT% Strategy"

can see that yours is 'off' a lot more of the time in comparision but with the benefit of reducing the off/on lag from what I can tell.

Yes, the percentage method can look deceptive just by looking at the ribbon
@peter2 also raised this in his recent post. Trends are always happening & there is no shortage of positions to take using the percentage method.

Think of it this way
If there is a greater percentage of companies going up than retreating it's logical to assume it is safe to trade. If the majority of companies are declining, don't buy, it's as simple as that. When the ribbon turns red, it's not necessarily a signal to exit a position even though one of my strategies does.

Certainly there is no free lunch with these things and always more to consider.

Everything I post is things that have helped in my trading
Constantly talking about my own strategies & how they work "for me" might be the catalyst for someone to do further research.

Skate.
 
Here is a story about a dead racehorse
The story is about Chuck who bought a retired racehorse from a farmer for $100.00.
The farmer agreed to deliver the horse the next day.

The next day he drove up & said
"Sorry, Chuck, but I have some bad news, the horse died."

Chuck, "Well, then just give me my money back."
The farmer, "Can't do that. I went and spent it already."

Chuck, "Ok, then, just bring me the dead horse."
The farmer asked, "What are you going to do with him?"
Chuck, "I'm going to raffle him off."
The farmer, "You can't raffle off a dead horse!"
Chuck, "Sure I can. Watch me. I just won't tell anybody he's dead."

A month later, the farmer met up with Chuck & asked
"What happened with that dead horse?"

Chuck, "I raffled him off. I sold 500 tickets at two dollars each & I made a net profit of $898.00."
The farmer, "Didn't anyone complain?"
Chuck, "Just the guy who won, so I gave him his two dollars back."

Skate.
 
Hi @ArtMaster,
I subscribed to The Chartist 4 years ago, I joined for two reasons. Firstly I needed to go cold turkey from a no plan, no idea, hope it works out style of investing, to let a professional tell me what and when to buy, so I started with the Growth Portfolio. Second was a site that provided resources and a reputable teacher for my trading knowledge to grow.

Growth Portfolio eventually proved itself (though first 4 months were tough with system drawdown -15%). Psychologically following the Growth Portfolio & listening to Nick has helped with the emotions of trading, though it did take a few years and with the drawdowns the portfolio has bounced back, I just need to stick to the signals.

Last year I decided to bite the bullet and build my own system for a second (small) portfolio, based on Nick's Bollinger Band Breakout in his book Unholy Grails. So bought Amibroker & Norgate data and spent a few months learning how to code, absolutely no previous coding knowledge but you have to start somewhere and if you start simple you can always build on it over time.

In regards to the turnkey code, even if Nick does run a modified version, I still expected the "vanilla" version to be profitable over time and I also have access to quality base code even if I don't understand it just yet. So late last year (might have been Black Friday deal, half price) bought Weekend Trend Trader turnkey and ran this out of the box beginning this year as my third portfolio.

Thanks to Skate, Peter2, qldfrog, Newt and many other quality posters on this forum, whether it be their answers or probing questions, along with perseverance in learning to code, knowledge improved and systems have slowly been improved.

With the turnkey WTT you don't necessarily need to understand coding to improve on it. There are a bunch of parameters you can simply adjust to make changes, once you understand what they do you have a better idea as to what can be tweaked and how it affects the system. The few parameter changes I made greatly improved WTT's overall performance.

For me The Chartist was a great place to start, became interested in systematic trading, just needed to give it some time, I gave it 3 years to prove itself (end of subscription) as long as I stuck to trading the signals. You can trade one of Nick's portfolios, buy and trade turnkey code (improve it over time) or even follow the discretionary portfolio, and as you mentioned there is plenty of educational content.

SID.
 
Trade anything going up
That statement should be with a proviso. Buy only positions that are going up that meet precise conditions & sell them when precise conditions are met. The strategy will find those positions no matter the sector.


Improving on an original idea
(LKE) has been mentioned on Twitter & in this thread so I'll use that as the example to demonstrate an improvement IMHO. The WTT strategy is a simple 20-period breakout. The original WTT strategy produces the buy & sell signals shown on the chart. The next chart is my recoding to take advantage of the exit. To reiterate, the exit is the money maker.

View attachment 145219


Being more selective
Strategy signals are generated when precise conditions are met. Being more selective makes sense when stronger signals are coming along at a great rate of knots.


View attachment 145220


I use a variety of buy filters
Earlier I discussed that a garden variety "Index Filter" using a simple moving average is robust but the lag can play havoc with your strategy returns. It's worth remembering that there is always someone making money even if you are not.

Index Filter versus a Buy Filter (the coloured ribbon)
A simple moving average to keep you on the right side of the market is better than having none at all. The "WTT% Strategy" incorporates a simple buy filter. If 50% of the companies in the "All Ordinaries" is up over a week, it indicates "to me" it's safe to buy. Using the percentage method treats all companies "as equals" rather than being weighted by the top few. The "green" colour of the ribbon at the bottom of the chart denotes when it's safe to take a position.

The upper & lower chart
In the upper chart, the original WTT strategy depends on a simple moving average to determine when a position can be taken, whereas the lower chart depends on the percentage value of all companies in the "All Ordinaries" to make that decision.

View attachment 145221

Summary
There is no reason to reinvent the wheel. I spend most of my time trying to improve the wheel, otherwise, we would still be using the wheels that were used on wagon trains all those years ago.

Skate.
Skate, thank you for this detailed and instructive post!
I have collected "rises versus falls" data for a while in the belief that "winners keep winning, losers keep losing" but have not been sure how to implement a sensible strategy. Your examples are quite motivating!
 
Skate, thank you for this detailed and instructive post!
I have collected "rises versus falls" data for a while in the belief that "winners keep winning, losers keep losing" but have not been sure how to implement a sensible strategy. Your examples are quite motivating!

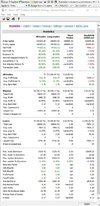
@entropy I'm not saying the results below are 100% attributed to the "Buy Filter" using the percentage method to enter & exit positions but I believe the percentage method is far superior to using an (SMA) Index Filter.

A short 365 Day Backtestperiod Period (12/8/2021 to today)
In the last 12 months, most trend followers are reporting that trading has been tough, some are still underwater. My UPDATED WTT% Version didn't suffer the same fate.

365 TOPP.jpg

Skate.
 
Top