Australian (ASX) Stock Market Forum

Dump it Here

The WTT Strategy is not too shabby
No matter the version you elect to trade, the methodology is solid. Adding a few bells & whistles improves on the original idea. (IMHO)

Is it time for a strategy update?
Strategies can work well until they don't. At times you don't realise there is a problem until it's too late. It's often said, "there is no answer when you can't see the problem".

Like cars, strategies can get a bit old
Sometimes a wash & a polish will get it looking okay, but without the required maintenance, it will soon become unreliable. Sure, any car in decent condition will get you to the supermarket & back but it's another thing to ask that car to win a race at Bathurst.

I've been playing with the WTT Strategy for ages
The WTT strategy in its original form lacks the bells or whistles to be competitive these days even though the methodology is sound. These last few years the returns have been disappointing & patchy. This strategy has been well discussed, thus making it the perfect strategy to use for the example.

Skate.
 
Twisting the strategy
Instead of using a "simple moving average" (SMA) to generate the signals, I use the percentage of the index to generate both signals. The only difference to "Skate's WTT Index Filter Strategy v1", version 2, uses the 50% ratio of advancing stocks compared to the number of declining stocks to generate the buy signal.

Now here is the twist
The sell signal is generated when this ratio falls below 25%. This is an additional "exit condition" annexed to the "Stale Stop" exit strategy. This "Percentage Filter" parameter forms part of the "Stale Stop" exit strategy that ensures the open position is sold when the percentage of the index is below a certain percentage value of 25%. Using this method concentrates on capital preservation & it's perfect for those that "feel twitchy" or "nervous" when deciding to have a punt.


View attachment 144593

Skate.
@Skate. Great stuff. I have never heard of using AD% this way. Very imaginative and clever.
 
Pleased to see you start with a market "sentiment" indicator.

How do we squeeze a little more performance out of a strategy?
The easiest way that I've found is to make sure it's adaptive to the emotional state of the markets. When this method is discussed, those who don't know any better will call this curve fitting. Curve fitting is another topic for another day.

Backtest (1 year)
The last financial year's results display that the markets haven't been kind to the original WTT Strategy, The Version 1 & 2 displays improvements

365 Days.jpg

Skate
 
Longer backtest (2 1/2 years)
Unfortunately, trading the original WTT Strategy would have been a struggle during the last 2 1/2 years, & the overall results are not that impressive "compared to the expectations" you would have had.

COVID changed the markets
There were a few reasons for the markets going off-kilter. The sentiment of traders changed so quickly, that they were frightened out of the markets. To be perfectly blunt, they simply got cold feet. In comes, "new players" who pushed the market higher & when that money fizzled out the markets retreated causing panic selling. With panic selling & poor economic conditions, the markets are finding it hard to recover.

The markets haven't been kind to the original WTT Strategy since the COVID flash crash
With a little re-tuning of the WTT Strategy as with Version 1 & Version 2, the improvements were there. Those still trading the original strategy, I believe, are starting to lose faith.

720.jpg

Summary
With a little time & effort, there are improvements to be found if the strategy has an edge. A strategy without an edge is like giving a dead racehorse to the best trainer & expecting him to do miracles.

Skate.
 
Trading successfully, the learning curve is steep
You could read hundreds of books, watch the market for years & still not be profitable. It’s time-consuming just trying to figure out all this stuff but to be successful in this game it’s imperative that you put in the work before investing. The dollars you invest are the same dollars you can spend elsewhere.

When is good enough, good enough?
Trying to find out what works need to be done before one dollar is invested into the markets. Buying a strategy is a quick way to start trading as the setup costs are relatively low.

FYI
Buying a strategy doesn't guarantee that you will make money. To me, education is the key.

Skate.
 
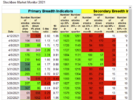
Market Breadth indicators...
El Sk8oh and Linus van Pelt both touched on this topic here in April last year.

1658920585181.png

Amibroker code for the above is in the Marsten Parker video in this post, starting around 1.47.00 in the video...

https://www.aussiestockforums.com/threads/dump-it-here.34425/post-1117599

Ha, I can hear the wailing already "what, free code, and I have to type it all myself" ??? Also asking myself how I ever managed to sit through that video, all three hours of it. I expect adequate supplies of Stella and smoked chilli mussels were involved ?
 
Longer backtest (2 1/2 years)
Unfortunately, trading the original WTT Strategy would have been a struggle during the last 2 1/2 years, & the overall results are not that impressive "compared to the expectations" you would have had.

COVID changed the markets
There were a few reasons for the markets going off-kilter. The sentiment of traders changed so quickly, that they were frightened out of the markets. To be perfectly blunt, they simply got cold feet. In comes, "new players" who pushed the market higher & when that money fizzled out the markets retreated causing panic selling. With panic selling & poor economic conditions, the markets are finding it hard to recover.

The markets haven't been kind to the original WTT Strategy since the COVID flash crash
With a little re-tuning of the WTT Strategy as with Version 1 & Version 2, the improvements were there. Those still trading the original strategy, I believe, are starting to lose faith.

View attachment 144613

Summary
With a little time & effort, there are improvements to be found if the strategy has an edge. A strategy without an edge is like giving a dead racehorse to the best trainer & expecting him to do miracles.

Skate.
Just a precision Mr Skate, for me and the followers:
Are these backtest results based on initial 100k, then investments on FIXED parcels of 20x5k
or do you reinvests your wins using a parcel size of 1/20th of portfolio value and so increasing parcel $ amount?
Just to confirm.
I tend to develop using fixed size as it removes a bit of the starting date timing effect
but it feels better to use the reinvested BT ?
and as this is the way i trade, that is the default running code post development to compare actual vs BT.
 
Are these backtest results based on initial 100k, then investments on FIXED parcels of 20x5k

@qldfrog that's a great question & it's worthy of a qualification
I'll answer your question directly & then explain my methodology to understand the minor differences in this regard. All my backtests have an initial $100k portfolio, making the results easy to understand using this amount. All my backtests have fixed dollar amounts so there is no compounding skewing the results.

The "Original WTT"
The information that is freely available on the internet the original positioning size is as you stated (20 x 5k positions). I couldn't find what "position score" is in the original strategy but from memory, I read once (that I can't now find) that the position score was set to "random". For a start using a "random" position score will tell you how effective the base code is, but very ineffective to get a baseline on all the metrics the backtest produces. I should also say at this point, the backtest results will be meaningless doing it this way as the "Annual Return %" will go up & down like a yo-yo. This means you will get hugely varying results. I've settled on the same position score that I use in my updated versions of the same strategy.

Skate's versions (v1 & v2)
There are a few differences to improve the strategy that has worked in my opinion. My research indicated one of those improvements was to alter the position sizing to (10 X $10k) bets. Using a larger bet allows the winners, to be more effective when the signals are being taken more selectively.

Similarities
The "Original WTT" & "Skate's WTT v1" uses a simple moving average of the index to determine the generation of the signals whereas "Skate's WTT v2" uses a different method that has been previously explained.

Skate.
 
"p2-starts-another-asx-portfolio-wkly-dly"

Making comments
@peter2 recently made a few comments & observations in his private member's thread "p2-starts-another-asx-portfolio-wkly-dly" that is not freely available to all so I'll repost my reply in this thread, keeping my posts in one place.

Peter nailed it
When he said, I should "modify the current strategy to earn what we can from the current market conditions". I went on to say that I believe he is on the right course. Peter succinctly nailed it in one sentence where it's taken me a handful of posts & a few graphs to explain the same thing.

The market will rebound, we just don't know when
In hindsight, it all looks perfectly clear what we should have done but in the heat of the battle, it's not so clear. When traders are losing they usually make up stories to convince themselves that what they are doing is the right thing. (at the time)

Poor logic
Ultimately, that logic leads to giving back big gains or incurring bigger losses as Peter pointed out. His yearly equity curve does a good job of confirming this. Traders are often paralysed into inaction, keeping them emotionally & financially tied to underperforming positions that "have a cost" while waiting for them to recover.

Selling is cheap & effective
It's by far the best management tool we have in our toolbox.

Skate.
 
What a buzz
@Captain_Chaza posted a video clip of the promotional song used for the "America's Cup" challenge that brought back so many good memories. I believe, it was the first time the "Boxing Kangaroo" logo was used.


America’s cup challenge (1983)
The crew signed the promotional poster for me that hangs proudly in my office to remind me that we Aussies are up to the challenge. (sadly not everyone who signed the poster is with us today)

They had a plan
Bertrand & his crew had a plan, a deliberate strategy, a psychological strategy not to refer to the all-conquering American team by their names ahead of the "America's Cup" challenge & it worked. Because they had a plan, a strategy coupled with the determination to win a yacht race shows nothing is impossible when you set your mind to it.

America's Cup Poster.jpg

Skate.
 
Have you ever had one of those days, you feel like crawling under a rock?
Being 69 in a few months I wanted to get my medical out of the way knowing I had to have a colonoscopy & a blood test.

If any were wondering
The doctor informed me I passed both tests with flying colours but suggested I have a sperm count done just to make sure I’m in perfect health. The doctor gave me a specimen cup & told me to fill it & bring it back the next day.

The next day
The Doctor seeing the empty specimen cup asked if there was a problem. Well, I said, this is embarrassing, I wanted to get the job done quickly, so as soon as I got home.

I got right to it
I tried with my right hand (nothing).
So, I tried with my left hand (nothing).
My wife tried with her right hand (nothing), & her left hand (nothing).
She even tried her mouth, teeth in, teeth out, (nothing).

Then my wife's best friend tried.
Right hand, left hand, mouth, still (nothing).
Under her armpit & between her knees (nothing)

Doc, I'm so embarrassed
There was nothing we did, that could get the lid off of the specimen cup.

Skate.
 
Why do we let losses get out of hand?
Whether you report a loss as a percentage or as a dollar figure, they both hurt like a bitch when they are stratospheric.

Big losses are hard to recoup
When you look at the returns required to get you back to "breakeven" after a stratospheric loss, simply highlights the damage your strategy has done to your portfolio. Recovering from a loss is painfully slow knowing that the markets always drop quickly & recover slowly.

Skate.
Indeed, i so wish you were wrong...but no..too true
 
Amibroker backtesting can fool you
Even the best software can give you a false sense of "security" to persist with a strategy when there really isn't an edge or an edge that hasn't been correctly established. Backtesting is not the be-all and end-all, as it's not the only important thing in strategy development or strategy evaluation but it does allow you an insight into how your strategy will perform when trading it live.

Backtesting uses historical data
To achieve meaningful results make the backtest count. There are always some do's & don't when it comes to interpreting the results that I wish to touch on.

For a start
Don't fool yourself by backtesting using compounding. It may look good on paper & helpful to sell a strategy but "reality" goes out the window using this method.

As an example
If you backtested a strategy with a starting balance of $100k with a position size of (20 X 5k bets) with compounding from 2012 to today your bets would have ballooned out to be $44k bets. Could you just imagine what they would be using $10k bets?

For a start
One, you wouldn't stomach using this position size & two, you wouldn't be able to move large sums in & out of the markets without affecting the price. Amibroker takes none of this into consideration as the calculations are pretty simple.

Skate.
 
What metric is the best to use when backtesting?
To be honest, traders will use the metric that makes their strategy "look the best". Having blinkers on when choosing what metrics to use is never the best idea. Personal preferences will dictate the metrics they'll use. Sadly, it's usually the ones they "believe" is the most important.

But there are some metrics that are constantly being overlooked

Today I want to draw your attention to two important metrics that are often overlooked. Concentrating on just these two metrics will make you a better trader over time. (IMHO)

Skate.
 
Let's face it, we all have our favourites
The Ulcer Index is an important backtest metric (to me) but as I've discussed the "UI" previously It didn't make my final two today but it's still worthy of a comment.

What Does Ulcer Index Mean?
The Ulcer Index is a technical indicator that measures downside risk in terms of both the depth & duration of price declines. The index increases in value as the price moves farther away from a recent high & falls as the price rises to new highs. Simply stated, it is designed as one measure of volatility only on the downside. Don't get me wrong, this is a powerful metric that tells a powerful story.

Skate.
 
Another great metric, but it didn't make the cut today
The Sharpe ratio is getting close to what I want to discuss as it touches on R&R & this ratio is a really important metric.

What is the Sharpe Ratio?
The Sharpe ratio is the relationship between risk & return, the measure of risk-adjusted return. The ratio measures the performance compared to the performance of a risk-free asset. The formula allows you to understand the risk to generate a return. Above (1.0) is good, & more than (2.0) is very good.

Skate.
 
A metric taken in isolation is never the best idea
You know, if you backtest the same strategy over different time frames, the metric will tell you a different story each & every time. It's confusing to even the most senior traders. Confusion reigns supreme in this game, second-guessing yourself is one of the hardest hurdles to overcome as confusion will lead you to inaction. The K-Ratio elevates this confusion to some degree.

What Is the K-Ratio?
The K-ratio is a metric that detects an inconsistency in returns over time. The higher K-Ratio, the more consistent return you may expect from a strategy. The K-Ratio should be (1.0) or more. The higher K-Ratio, the more consistent returns you may expect from the strategy.

Next
Let me explain two metrics to add to your toolbox when assessing the likely hood of a strategy being profitable.

Skate.
 
Well, it's taken a few posts, But I've finally got here
There are two metrics that are simple to understand but often ignored when evaluating a backtest report. (1) The Risk Reward Ratio & (2) the Profit Factor are two metrics that we must always pay attention to. Concentrating on these two metrics will make you a better trader over time. They both tell the story we all should be listing to.

# 1. The Risk-Reward Ratio
Simply stated, this is the ratio of potential risk & potential reward of the trading strategy. You can take it from me, the "higher" is better. The risk/reward ratio, sometimes known as the R/R ratio, is a measure that compares the "potential profit" of a trade to its "potential loss". It is calculated by dividing the difference between the entry point of a trade & the stop-loss (the risk) by the difference between the profit target & the entry point (the reward).

# 2. The Profit Factor
The profit factor is a popular performance metric & is simply the ratio of the profit of winning trades divided by the loss in losing trades. As with the R&R ratio "higher" is also the better. A trading system is profitable if the profit factor ratio is above (1.0) whereas a factor of (2.0) or more is excellent. A profit factor higher is considered outstanding.

Skate.
 
Top