Australian (ASX) Stock Market Forum

Dump it Here

The metrics you indicate are important to you also make sense to me, except the 'Stale Stop', could you elaborate?

If you do a search, there would be at least 60 posts that I've made on the subject.

Is it possible to re-run you code and report the backtest results for say the approx five years only 2018 to 2022?
I am interested to see how the more recent data pans out.

Sure, no worry. I'll be out of the office for about an hour & will post them on my return

Skate.
 
Is it possible to re-run you code and report the backtest results for say the approx five years only 2018 to 2022?
I am interested to see how the more recent data pans out.

Looking for long-term trends
@entropy it's refreshing when others ask for a backtest over a shorter period. Backtesting over a long period & the report becomes ineffective (IMHO) to qualify any long-term trends. The longer the backtest period you use can just add complexities in evaluating the results as the returns could be down to sheer luck.

Strategy evaluation
I'm not convinced using a single backtest can really supply the information required without gathering more information on the side. Indeed, even strategies with nearly identical construction rules & long-run average returns can deviate meaningfully through time. The lesson for mechanical system traders is to remain cautious when interpreting past performance results.

The backtest period is important
At this stage, I should point out that there are two camps when the "time issue" of backtesting is raised. We have previously discussed what length should be used when backtesting to achieve meaningful results. There are some who prefer longer backtest periods & their opinion completely differs from mine. I believe more "meaningful" information is gathered using shorter-term backtests to evaluate the metrics. The effectiveness of those metrics can diminish when backtesting over a longer period.

Longer the backtest doesn't always equal better
Performance results can be like “chalk & cheese” when conducting an evaluation over massive time frames. Performance observed in the past may offer little insight into the strategy performance in the short term. All I'm saying, markets have changed over the last 14 years.

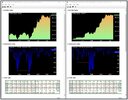
2018 t.jpg


Equity 2018.jpg

Skate.
 
The metrics you indicate are important to you also make sense to me, except the 'Stale Stop', could you elaborate?

After I buy when do I sell?
@entropy, I've made plenty of posts explaining that selling is where the money is made. Successful trading is largely the art of selling. Buying a stock is easy. It is determining when to cut our losses or when to take our profits that is the hard part when it comes to trading. Because it is so hard to determine when it is the right time to sell, many just don’t do it. Successful selling needs to be timed. One timing method that I use is my "Stale Stop Exit". When a position is not performing as expected or stagnating due to the lack of momentum, I'm out.

Stale stop exits
A "stale stop exit" correctly implemented not only has the ability to make money but also keeps my strategies in rotation mode by disregarding the non-performers quickly freeing up a position & capital. There have been some who have tried to code & implement something similar to my "Stale Stop Exit Strategy" with limited success. For the "Stale Stop Exit" to be effective it needs to measure "bar-by-bar" necessitating it to be in a loop or it will fall short of expectations.

Skate.
 
"The combination of inflation, higher interest rates and oil prices, the Ukraine war and Covid-19 are creating unprecedented challenges that will impact markets for months to come. This week these good results inspired a new wave of confidence in stock markets. But whether it be Australia, the US or Europe the challenges in the current half year are going to be very different."

The new stock market indicators that may surprise you

JB HiFi led the way in showing that many Australian companies adapted brilliantly to the conditions in the half year to June 30. And the US is reporting similar corporate achievements because American companies also adapted well.

This week these good results inspired a new wave of confidence in stock markets. But whether it be Australia, the US or Europe the challenges in the current half year are going to be very different. And China is dangerously close to another Covid-19 disaster.

As global share investors take in this emerging environment many will reassess strategies.

In Australia, the CBA bank warns that backward looking indicators like low unemployment and past inflation rates conceal what is now really starting to happen. A reliable indicator a future trends is CBA’s internal credit and debit spending which shows that consumers are reacting to higher interest rates and cost of living pressures by moderating discretionary spending. The peak in spending occurred in mid‑May, just as the RBA started to lift the cash rate.

Since then there has been a 2 per cent point fall in card spending – largely concentrated in discretionary spending categories. Spending has continued to lift in transport fuel and power. My conclusion is that in the coming interim reports investors should watch for directors comments on current trading.

In the US demand for new mortgages has slumped in the wake of higher interest rates. Gasoline inventories rose 3.5 million barrels last week, far exceeding analysts’ forecasts.

Product supplied --- a proxy for demand --- was about 8.5 million barrels per day, or 7.6 per cent lower than the same time a year ago. High gasoline prices and interest rates have clearly undermined US consumer confidence.

In the wake of the shortages of Russian gas, the European Commission says European countries should immediately start rationing use of the fuel and cut their use by 15 per cent until next spring. Proposed legislation would grant the Commission powers to force member nations to follow a strict plan of energy consumption cuts. If legislated, the plan would put Europe’s economy on war footing because of Russia’s invasion of Ukraine.

The IMF said this week there was a high risk that Russian gas supplies to Germany might suddenly stop forcing Germany to ration supplies to heavy industrial users. The IMF estimated this disruption would wipe out as much as 3 per cent of German gross domestic product and drag the economy into recession.

Germany would face calls for “further relief measures” to support companies and households, such as maintaining the expanded Kurzarbeit furlough scheme and providing more grants to the hardest hit companies.

China benefits from European misery by buying cheap gas and oil from Russia. But it faces a resurgence of coronavirus outbreaks, with cities across the country reimposing restrictions as authorities rush to stamp out cases of the more infectious Omicron variant that has become dominant in the west.

The FT reports that Macau, which is undergoing its worst Covid-19 outbreak yet, has closed of all non-essential businesses, including casinos.

According to Japanese investment bank Nomura, eleven Chinese cities are now under full or partial lockdowns, affecting 115 million people, or 8.1 per cent of the population. The cycle of outbreaks, mass testing, lockdowns and easing will continue under President Xi Jinping’s stringent zero-Covid-19 policy, although authorities were trying to implement more targeted measures such as shorter quarantines and limited lockdowns.

The combination of inflation, higher interest rates and oil prices, the Ukraine war and Covid-19 are creating unprecedented challenges that will impact markets for months to come.

ROBERT GOTTLIEBSEN
BUSINESS COLUMNIST
 
unprecedented challenges

@JohnDe, by highlighting the issue of "unprecedented challenges" allows me to make another post to explain why a smart wimp who runs & hides when the going gets tough generally produces better results. It also allows me to make a few comments about "stops". Using a combination of stops in my opinion is better than just using one.

Stops
A "Take Profit Stop", & a "Stale Stop" combined with a "Trailing Stop" can be very effective in combatting the "unprecedented challenges" that Robert Gottleiebsen described in his article.

Selling is a valuable tactical tool
Selling is by far the most valuable tactical tool that any trader has at their disposal. Selling is cheap, easy & can be undone in the blink of an eye. Too many seem to think that if they sell, they are somehow prevented from buying it back again. Not so.

Exits that work together are effective
In fact, I’ll go so far as to claim if you sell at the correct time or when the going gets tough generally produces better results than brave souls who are proud of their ability to suffer great monetary pains while they wait for the position to recover.

You can take this to the bank
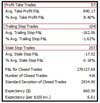
When you have a high number of "take profit" exits your strategy is doing something right. As the exits are so important (to me) I've added those metrics to the bottom of every backtest I carry out.

2018 EXITS.jpg

Skate.
 
If you do a search, there would be at least 60 posts that I've made on the subject.


Sure, no worry. I'll be out of the office for about an hour & will post them on my return

Skate.
Thanks Skate!
I had no idea how useful the Search facility could be.
Your comments caught my interest:

(Quote)
The "Stale Stop Exit" is a little more complex
The Stale Stop Exit does a mighty job & is a combination of 6 conditions.
It's extremely difficult for me to explain how it works without revealing the complex coding involved.

Rapid changes in price
First off the "Stale Stop Exit Strategy" gauges when momentum is shifting, slowing, or reducing but
that's not all that it does as it's time-dependent as well.
There are multilayers to the "StaleStop Exit" as momentum needs to be calculated bar-by-bar in
relationship to previous bars.
Each position is only given enough time to confirm its worth.
Positions that don't keep improving are not worthy of keeping.
(End quote)

Excellent idea re closing sluggish performers and redirecting the capital.
 
What is position sizing?
For those who don't understand, I should have explained what "position sizing" is In its most basic form. There are those who have trouble with some of the technical terms & this follow-up post will clear this one up.

How much do we bet?
Well, that's a greaty question. The "Position Size" you use decides what your next bet will be in relation to your trading account balance. Position sizing can truly be a powerful tool used correctly. Ultimately, I forgot to say previously that it is up to you to decide what you want to accomplish & how much “portfolio heat” you want to incur as @peter2 would say.

Trading is all about "trying to secure your financial future"
Remember you can’t make money without losing money. As with all trading tools they only work if you consistently use them. Confidence & consistency is the name of this game, as well as money management techniques of course.

Skate.

Skate, you raise here some good points!
Position sizing has been discussed a lot by Bill Ziemba, sadly he has recently passed away but left behind a remarkable legacy.
He made a lot of money for himself and for clients using the Kelly Criterion for sizing.
Attached is a pdf that may be of interest, he tags Buffet as a "Full Kelly Investor".
 

Attachments

  • the-great-investors-their-methods-and-how-we-evaluate-them-theory.pdf
    466 KB · Views: 15
Position sizing has been discussed a lot by Bill Ziemba

@entropy thank you for the pdf. I'm set in my ways when it comes to position sizing.

I have a procedure to take advantage of profits & losses
Both profits & losses determine my next bet size or the dollar amount of my next series of bets. Closed profits mean the next bet or series of bets increases whereas losses decrease the next bet or the next series of bets.

When backtesting
The position size needs to be a fixed dollar amount so compounding doesn't skew the results.

When it comes to "live trading"
I use a pyramiding system (my terminology) to ensure that every dollar is placed in the market. I often call dollars soldiers & relate trading to fighting a battle. If I'm to have any chance of winning the war, I want every soldier in the battle instead of lounging around in the barracks.

Let me explain further
Pyramiding (my terminology) is simply increasing or decreasing the next bet size that my trading funds will allow. Pyramiding is a re-balancing technique coded into my trading strategy to calculate the next bet size & the number of shares to buy in the pre-auction. Position sizing this way allows every dollar/soldier to be put into the market/battle to fight the good fight.

How?
A Bank feed is sent to a parameter setting within the AFL strategy code & the formula is quite simple. It's simply a way of putting every dollar to work.

Trading Bank Balance/outstanding positions = new "PositionSize" (formula)
The formula above calculates the new bet for every pending new trade. The other part of the code calculates the "Buy Offer" & the "number of shares" to buy in the pre-auction.

## Update ##
I went off half-cocked believing the pdf uploaded related to position sizing, thus the instigation of my posts. Bill Ziemba doesn't touch on the subject of "Position Sizing" in the article but maybe he has in a previous publication.

Skate.
 
Last edited:
## Update ##
I went off half-cocked believing the pdf uploaded related to position sizing, thus the instigation of my posts. Bill Ziemba doesn't touch on the subject of "Position Sizing" in the article but maybe he has in a previous publication.
His position sizing is the Kelly criterion.
As it was for Edward Thorp of blackjack fame.
Like Ziemba was, Thorp is a very successful stock trader with outstanding academic credentials.
Ziemba was also a prolific writer on many things financial, he said writing helped to clarify his thoughts and actions.
Kelly sizing is simply investing a proportion of your bank in line with your edge.
It is designed to maximize the long term log(wealth).
It requires an accurate assessment of one's edge but has some features that are contentious.

How much money should we allocate to each bet?
That in itself is an interesting topic for discussion but I would rather talk about something that actually makes "me" money. But before I move on I want to give a condensed version of what @entropy eluded to earlier about position sizing, using the Kelly criterion.

Generating interest
I appreciate any discussion that sparks interest & my interest was certainly sparked learning that Bill Ziemba made a lot of money using the Kelly Criterion for bet sizing was worthy of further investigation.

Skate.
 
So what is the Kelly criterion?
Kelly criterion is a mathematical formula for bet sizing, which is frequently used to determine the optimal "theoretical size" for a bet to determine how much money should allocate to each trade. Theoretically, using the Kelly criterion it's reported that it "should" result in higher wealth "over time" compared to other types of strategies.

The "better off" test
I'm not that convinced "at this stage" using this method of position sizing (for the bulk of us) would grow your wealth any faster without increasing the risk of ruin. There are other methods I would be concentrating on before using the Kelly criterion position sizing calculations.

I would prefer you first try one of these first
Use a fixed dollar amount or a fixed percentage of the portfolio allocated to each position, you can even use the ATR to decide the position size. By trying these methods first it allows you to see how each of those position sizing methods impacts the number of shares & dollar value attached to the trade. By doing it this way you'll get a feel for it. Also, with a backtest report you'll see the impact on the net results in a heartbeat.

Skate.
 
How much of my trading funds should I bet if the odds are in my favour?
Using this method of thinking can lead to an undesired outcome with your trading because the outcome is never known. Using Kelly's criterion is about maximizing long-term growth. I'm the first to admit that "position sizing" can & does have an effect on returns, but is insignificant in the scheme of things.

There is a Kelly criterion calculator
This calculator is freely available on the internet for you to work this stuff out. But be warned as the calculator depends on your "assumption" of the probability as a percentage you apply to the success of an individual trading decision. Frankly, this is where "position score" trumps "position sizing" at every turn. Also, mucking around with the "position size", the size of your next bet will results in a minuscule difference compared to the results you can achieve through using a correctly coded "position score".

I should also say
No matter what the Kelly criterion position sizing is, to be effective your trading strategy needs to have an edge. You cannot take a losing system & change it into a winning one through "Position Sizing". The system must be profitable to start with.

Skate.
 
I want to discuss today Buy Filters, Index Filters, & Regime Filters
They are all the same using different terminology (IMHO) I want to make a series of posts to explain what filter you should use to keep you on the right side of the markets. This exercise is not to determine whether to trade with or without a "Filter", but rather a novel way to decide when to trade while still utilising the index you are trading.

Let's name the Elephant in the room "Moving averages"
I don't care which moving average you use they all have a varying degree of lag. So how can we decide on what method to use that gives us a fighting chance of getting it right without the lag. Using a lagging indicator such as a "moving average" to keep you in or out of the market at times is a "foolish idea" because it guarantees that you get into the trend too late & gets you out just as late. Both scenarios are not desirable as affect the returns you'll likely achieve.

The real question
When should we trade? & is there a better alternative than using a moving average of the underlying index? I think there is. That's what I want to talk about, a subject that makes "me" money.

Skate.
 
I should also say
No matter what the Kelly criterion position sizing is, to be effective your trading strategy needs to have an edge. You cannot take a losing system & change it into a winning one through "Position Sizing". The system must be profitable to start with.
Skate, Absolutely!

I would like this comment of yours tattooed on my forehead so that each time I looked in a mirror I get a reminder.

If one does not have a demonstrable positive expectation then Kelly says do not invest.

Casinos know the exact edge they have on any game.
If players find an edge eg card-counters in blackjack, the casinos introduce counter measures like bet restriction and automatic shuffling machines or just outright banning the player.

How to estimate your edge has perils and is a big subject in itself.

Full Kelly has some scary implications like huge swings in the proportion of bankroll invested, infinite divisibility of the amount invested, equal utility for the doubling of a 1K bankroll or a 1M bankroll.
There are ways of dealing with these issues, fractional Kelly being common.

It was long ago shown mathematically that if there were say just two investors competing in a market, one using Kelly sizing and the other any other non-Kelly sizing method, and both using the exact same strategy to choose an investment, then "eventually" the Kelly one would end up with all the money.

I wrote "eventually" deliberately, it could take centuries!!
 
How to estimate your edge

@entropy that's a great segue into explaining why trading with the markets rather than against the markets can give you an edge. Usually, filters are deployed to this job, some better than others & that's what I wanted to discuss today.

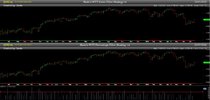
I want to discuss the charts & the indicator below the charts
First off, I'll use my version of the "Weekend Trend Trader" with "Skate Tweaks". There are those who own the "Turnkey WTT strategy" who can easily compare the results I've achieved as a benchmark. In a later post, I will upload when my backtests for (v1 & v2) of the WTT strategy for a comparison of the "Filters" used to keep you in & out of the markets.

The ribbon tells the story
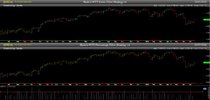
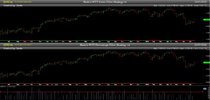
If the ribbon is green the index filter is "On". When the ribbon is red index filter is "Off". But what I want to discuss is the colour of the lower ribbon on the chart "Skate's WTT Percentage Filter Strategy" (version 2).

The lower ribbon also tells the same story
On the lower chart "Skate's WTT Percentage Filter Strategy" (version 2) the ribbon colour is derived a little differently. The colour coding is the same inasmuch that if the ribbon is green the index filter is "On". When the ribbon is red index filter is "Off". So what drives the colours? & is the "Filter" used in "Skate's WTT Percentage Filter Strategy" any better than the moving average filter used in the upper chart?

The answer in a nutshell
I think so.

The indicator
There is also an indicator at the bottom of both charts but it only relates to the chart directly above being "Skate's WTT Percentage Filter Strategy". I want to explain the indicator but to do so I will have to repeat the charts in each post so you don't have to refer back.

Filters.jpg

Skate.
 
Some Background
The top chart "Skate's WTT Index Filter Strategy" (version 1) uses an "index filter", a 10-week moving average of the All Ordinaries (XAO). This means if the close is above the 10-week (SMA) the index filter is "On". Alternatively, when the close is below the 10-week (SMA) the index filter is "Off".

The ribbon is a visual representation
The colour denotes if it's safe to trade. There are only two colours, green & red, meaning the filter is either "on" or "off". There is no in-between.


Filters.jpg


Skate.
 
Pleased to see you start with a market "sentiment" indicator.

Your version 2 looks a bit spotty, too intermittent and it's more off than on even when the index is rising.
(edit: You may be planning on "smoothing" it. sorry if I posted early.)

A mkt filter based on your Ducati blue bars indicator on the XAO would look better.
 
Pleased to see you start with a market "sentiment" indicator.

Your version 2 looks a bit spotty, too intermittent and it's more off than on even when the index is rising.

A mkt filter based on your Ducati blue bars indicator on the XAO would look better.

@peter2, thanks for your input but today is an exercise in explaining that there are more ways to skin a cat than what is usually discussed.

I did touch on this method some time ago
But at the time there was little interest as most didn't understand the procedure I was discussing or they just didn't understand how it was implemented.

I wanted to explain the different filters I use to get the job done
Yes, the ribbon looks spotty but that's because of the percentage of advancing compared to declining positions converted to a "percentage" of the index. Let's wait to see the difference using another "Filter" can make to a strategy before passing a quick judgment.

Skate.
 
Let's concentrate on the lower chart
The ribbon on the lower chart "Skate's WTT Percentage Filter Strategy" uses the percentage of the index to drive the colour of the ribbon. As you can see the "spottiness" of the ribbon @peter2 is referring to but in reality, this means you are restricted in buying when the ribbon is red. I use this indicator as part of the "Stale Stop" exit strategy that ensures the open position is sold when the percentage of the index is below a certain value. Using this method concentrates on capital preservation. This indicator (filter) is perfect for those that "feel twitchy" or "nervous" when deciding to take a punt.

The Indicator
This indicator simply displays the number of advancing stock of the All Ordinaries compared to the number of declining stock as a percentage. Now the coding is not simple & there is a heavy drag when searching for signals or when doing backtesting (because of the looping required) but it's a small price to pay when you want to use an alternative to using a simple moving average of the index.

At the moment
As the All Ordinaries (XAO) is currently (67%) that's above the threshold of (50%), indicated by the red horizontal line. When this happens the ribbon turns green indicating it's "safe to trade", whereas the 10-week (SMA) ribbon indicates it is not safe to trade as the ribbon is displaying "red" keeping you out of an advancing market.

Filters.jpg


Skate.
 
Is it possible to re-run you code and report the backtest results for say the approx five years only 2018 to 2022?

So there is no cherry-picking
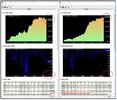
All backtest going forward will be on the dates suggested above. Backtest period, 1/1/2018 to today. Using the number of advancing positions in the relationship of decliners converted to a percentage is an alternative.

T.jpg


EQ.jpg

The only downside
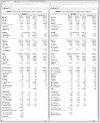
Slow execution of the "Percentage Filter" due to the heavy looping required.

"Skate's WTT Percentage Filter Strategy"
Time.jpg

"Skate's WTT Index Filter Strategy"
v1 Time.jpg

Skate.
 
Last edited:
Top