
- Joined
- 17 October 2012
- Posts
- 707
- Reactions
- 1,389

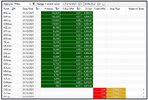
Thanks—hope it is informative. I’m trying to do this at the end of each quarter. My last post was the end of Q1 so if you specifically want my last post on this look back to end of Sept early Oct. Happy new year to you.Thank you so much for sharing your YTD performance figures system across 3 very different systems MovingAverage. I was actually digging back the other day trying to find the last time you'd shared this. I'm personally down as much as you're up over a fairly challenging 6 months. Kudos for do what you doing and continuing on with business. ?


You can't go wrong buying stocks when they start to go up. Sell any that don't follow through and hold the winners.
the age old question , ' should i have waited longer ( higher ) or should i have sold at all '
In all of my 25 years of trading, the most costliest mistake has ALWAYS been not selling a stock. If anybody asks what the most important part of trading is to me, I tell them "learning how to pull the trigger on a sell".
knowing "when to sell the winners" is the secrete.
Lets hope it doesn't leave a nasty stain on the carpet, then....is the secrete.
New Positions: CXL, LTR, AGY, QPM


Lets hope it doesn't leave a nasty stain on the carpet, then....
Proof reading
I apologise for not proof reading my post.
When others post
It's exciting to experience how other traders make their stock selection & the methodology that decides when a position is to be entered. Admittedly I don't have the time or unique skills-set to evaluate positions in this manner. My go-to is either the weekly or daily "Ducati Blue Bar Strategy" to understand the reasoning a little better. Coding is pretty straightforward & it's easy to chart positions to understand the logic behind the selection.
Volatility & volume within an up-trend
"The Ducati Blue Bar Strategy" is easy to understand as the first "Blue Bar" is the signal bar, meaning we enter the position on the next day at the open. We sell the position on the 2nd red bar as the first "red" bar is the signal bar. "The Ducati Daily Blue Bar strategy" is a simple "volatility & volume" picking the increased "volatility & volume" of individual positions & plotting them with Blue & Red Bars so there is no mistaking what's going on with the price.
@peter2 New Position (AGY)
"The Ducati Blue Bar Strategy" plots the timing to enter & exit this position. Simply buy the 2nd BLUE bar & Sell the 2nd RED bar.
View attachment 135040
Mechanical System trading
History has proven this style of trading works (Trend Trading). "The Ducati Daily Blue Bar strategy" is a simple "volatility & volume" picking the increased "volatility & volume" of individual positions & plotting a time to buy & sell, a simple & effictive process.
Skate.


After all we're both trading the same types of price moves, trend and momentum and these can be easily defined.
No Skate, I was very careful to post a weekly chart and not a daily chart, my time scale was a 12month period I think your time scale may have been nine months. Otherwise, my comparison would have been pointless.Daily Charts
My previous charts for (AGY, CXL, LTR) were weekly charts & as @Ann posted a daily chart for AGY it's fitting to re-post the charts for the same periodicity. Each chart displays the entry & exit points for comparison only.
@peter2 & @Ann have the unique ability to read chart patterns as they are developing.
It’s really for you to decide between Technical & Fundamental Analysis or it can be a combination of both.
Chart readers have a unique ability to express their opinion on certain information that validates what we already know to be true & then create a story about it to make sense out of the event as we attempt to explain it to ourselves.
Rollover to the SMSF is now complete. Funds have been transferred to the trading account. Funds have arrived. Ready to rock 'n' roll.
I've been reviewing my backtest and trade stats (which I am more than comfortable with) and trend following is to let our open trade profits run to allow us to hunt down outlier trades that make most of the systems money, why are we so concerned with drawdowns?

You totally misunderstand what charting is all about Skate, we as chartists do not need to 'create a story' all we will say is what aspects of the chart we may be focused on and attempt to share our view with others.
Charting
Chart readers always protect there arse by saying it could go this ways, than again the price may go the other way (bloody confusing at best) Furthermore, I’m suggesting that chart patterns are easy to interpret after they happened & they are more predictable than they were before they occurred.
If you have an alternative view on this post, please feel free to express it. (I'm expressing my opinion only)
If opinions didn't differ there wouldn't be any trading..
like many other members on ASF "I have an opinion".
Sometimes you may not like my opinion if so don't worry - "I have plenty more"
if I was holding FMG, then I would need to make a decision about an exit or not if it continues under $20.

For Comparison
@Ann Daily chart for FMG
A difference of opinions is healthy
Having an alternative view to others & expressing in a polite manner is how we learn but once an alternative is expressed robustly it can quickly escalate encouraging others to join in. Instead of arguing the point, they tend to attack the person with the intent of upsetting them until they respond emotionally. After reading some comments in "another thread" it's time to make a general comment.
We use cookies and similar technologies for the following purposes:
Do you accept cookies and these technologies?
We use cookies and similar technologies for the following purposes:
Do you accept cookies and these technologies?