Australian (ASX) Stock Market Forum

Dump it Here

Most fail to realise rebalancing works both ways
Re-balancing the next bet works for me as I need all my available funds to be constantly in the markets. Most fail to realise re-balancing works both ways. When trading is not going well, the size of the next bet decreases because of the losses incurred, even a string of losses is reflected. Boy, when times are good why shouldn't I take advantage of these conditions & increase my bet sizes. It's "making hay while the sun shines".

In summary
If you are backtesting & "not live trading" it would be advisable to backtest "only with a fixed dollar amount" ensuring that the backtest results will be accurate, constant, believable & achievable. The backtest period becomes irrelevant using a fixed dollar amount. Using any other method "cooks the books" & certainly "skews the results". Well, it's a first for me to learn others backtest using methods other than the "Fixed Dollar Amount".

Skate.
 
Skate,
I fully agree backtesting should not include compounding but should be based on a fixed equity.
However I also believe backtesting should reflect how trades will be executed in practice.
The backtests you have posted above seem to assume you will be buying a fixed dollar amount at the opening price, and you are willing to pay that opening price whatever it may be.
If that is how you intend to trade then that's fine. But I suspect most of us enter trades with a limit and thus backtesting scripts should reflect that or be potentially misleading.
For example would you have taken the trade in LVT at the end of 2017 that is shown in your backtest?
 
Skate,
I fully agree backtesting should not include compounding but should be based on a fixed equity

@elbee that was the point I was trying to get across. During a strategy development stage & parameter settings, a fixed dollar amount will be accurate, constant, believable & achievable.

However I also believe backtesting should reflect how trades will be executed in practice.

This is where we depart. Trading using the Backtest trade management feature will be reflective of how you decide to trade. But running a backtest to qualify the trading results over many decades becomes irrelevant because when live trading you wouldn't be able to enter those trades at the value recommend.

The backtests you have posted above seem to assume you will be buying a fixed dollar amount at the opening price, and you are willing to pay that opening price whatever it may be. If that is how you intend to trade then that's fine.

No, this is not how I trade it was an exercise to show others how backtesting using alternative methods of a short 4 year period can skew the results giving you a false sense of security to place your money down. I'm made a multitude of posts explaining in great detail how I enter a trade & why, I have also posted parameter captures so it's easy to understand. I trade in the pre-auction only, which has already been discussed as well.

But I suspect most of us enter trades with a limit and thus backtesting scripts should reflect that or be potentially misleading.

Now we are back on the same page. Trading through the "Backtest" Portfolio manager using whatever position size you decide is up to you, it's a personal choice. But if you want to test the validity of one entry over another, one parameter over another, or one filter instead of another - all I'm suggesting is that you use a metric that compares & contrasts the results by using a constant fixed dollar position as your starting point.

For example would you have taken the trade in LVT at the end of 2017 that is shown in your backtest?

Your question is too vague as you didn't say which backtest you were referring to. So you don't have a follow up question my answer will be just as vague.

"I might have, or I may not have - it all depends"

Skate.
 
Monte Carlo Parameter Settings

Monte Carlo.jpg

Simulate Using Trade List - Position sizing
Position sizing defines the position sizing method used by the Monte Carlo simulator in "trade list" mode:

Don't change
This uses the original position size as used during backtest. Keep in mind that it always uses the original dollar value of the trade, even if your formula is using percent of portfolio equity.

Fixed-size
This uses a fixed number of shares/contracts per trade

Constant value

This uses a fixed dollar amount for opening any trade

# Percent of equity #
This uses a defined percent of the current simulated equity value. Be careful when using this setting - it causes that position size of one trade depends on profits on previous trades (compounding profits) and creates serial dependence. It may also lead to extra compounding effect when you have overlapping trades in your original backtest as bootstrap performs trades sequentially (so they don't overlap). For this reason, its use is limited to cases when no overlapping trades occur.

Best practices
To remove risks of serial correlation affecting the results of Monte Carlo simulation it is highly encouraged to use fixed position sizing (either fixed dollar value of trades or fixed number of shares/contracts), so the order in which given trade occurs in the original sequence does not affect its profit/loss due to compounding.

Summary
If Amibroker Monte Carlo uses fixed position sizing in their calculations it's the reason why they "highly encourage" you to use fixed position sizing when backtesting to eliminate the effect of compounding. Eliminating the compounding effect, the results will be accurate, constant, believable & achievable.

Skate.
 
Why bother backtesting with a position sizing model that does not compound realised profits? This does not make sense to me.

@MovingAverage supplied the perfect answer is below
IN MY OPINION when you’re initially building, evaluating or refining your system I’m just suggesting it be done without the influence of position sizing. By all means factor in position size but that should be done after you’ve settled you’re initial system using fixed position sizing. You can then get a better understand of how much of your strategy’s performance can be put down to the system per se and how much to position sizing.

Altering the next bet size (rebalancing in response to recent performance
Re-balancing the next bet works for me as I need all my available funds to be constantly in the markets. Most fail to realise re-balancing works both ways. When trading is not going well, the size of the next bet decreases because of the losses incurred

Adjusting position size on a trade-by-trade basis in response to recent performance. The key to staying profitable is continuing to monitor the recent trades, reducing position size when in a drawdown and increasing position size when the system is working well.

The position size is fixed or is determined within the trading system model. It should not be fixed. It should vary as the performance varies. It should not be determined within the trading system model. It should be determined within the trading system Management model. This gives the trader an opportunity to tune position size as performance changes, and to recognize the onset of system failure in time to reduce position size to protect account.

Skate.
 
The 20% Flipper Strategy
This strategy has been done to death over the years but with a new perspective, my interest has been reignited. I'm now wondering if the basic Flipper strategy can be improved?

The Flipper is a very simple trend trading strategy
With slight modifications & a few extra filters, I found the Flipper to work well in these trying times. The Flipper also worked well in the last quarter of 2018 & in Feb/March of 2020 which were both difficult trading periods. The Index Filter & the exit strategy limited the drawdown during these periods.

The basic rules are very simple
If a stock moves 20% from a low point, you buy & if a stock falls 20% from a high point, you exit. With a slight deviation from the original 20-positions to a 10-position portfolio, trading it weekly, the results aren't too shabby at all. The strategy premise is sound but with a new combination of filters & additional exit conditions, the returns become more consistent. It's surprising since 2000 it has never had a losing year.

Weekly Backtest Setting
Norgate Platinum Subscription.
All Ordinaries Current & Past.
$100k, 10-position strategy.
$10k fixed position size.

5 year backtest
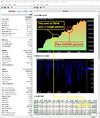
During this 5 year period, there were two tough trading periods (the end of 2018 & the Covid Flash Crash Feb/Mar 2020) & the Flipper handled both of them with ease,

5 Years.jpg


3 year backtest
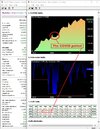
The COVID flash crash "wasn't too scary" for the Flipper as most trend-following systems failed to exit quickly enough when the trend turned.

3 Years.jpg


It's a work in progress
I've incorporated a market timing system & used the percentage of the "Rate of Change Filter" as the momentum indicator. I've also found that you need a bullish indicator to control the entries. Taking the raw signals without these extra filters & the returns can be very patchy at best.

Skate.
 
The 20% Flipper Strategy
This strategy has been done to death over the years but with a new perspective, my interest has been reignited. I'm now wondering if the basic Flipper strategy can be improved?

The Flipper is a very simple trend trading strategy
With slight modifications & a few extra filters, I found the Flipper to work well in these trying times. The Flipper also worked well in the last quarter of 2018 & in Feb/March of 2020 which were both difficult trading periods. The Index Filter & the exit strategy limited the drawdown during these periods.

The basic rules are very simple
If a stock moves 20% from a low point, you buy & if a stock falls 20% from a high point, you exit. With a slight deviation from the original 20-positions to a 10-position portfolio, trading it weekly, the results aren't too shabby at all. The strategy premise is sound but with a new combination of filters & additional exit conditions, the returns become more consistent. It's surprising since 2000 it has never had a losing year.

Weekly Backtest Setting
Norgate Platinum Subscription.
All Ordinaries Current & Past.
$100k, 10-position strategy.
$10k fixed position size.

5 year backtest
During this 5 year period, there were two tough trading periods (the end of 2018 & the Covid Flash Crash Feb/Mar 2020) & the Flipper handled both of them with ease,

View attachment 134847


3 year backtest
The COVID flash crash "wasn't too scary" for the Flipper as most trend-following systems failed to exit quickly enough when the trend turned.

View attachment 134848


It's a work in progress
I've incorporated a market timing system & used the percentage of the "Rate of Change Filter" as the momentum indicator. I've also found that you need a bullish indicator to control the entries. Taking the raw signals without these extra filters & the returns can be very patchy at best.

Skate.
Those results look like they have potential. Heard a lot about the 20% flipper but never really bothered to look at it in detail. A question for you: the 20% from a low entry—is that from a pivot point; that is are you looking for downtrends that have pivoted (bounced up) by 20%? This is very different from a simple 20% increase.
 
Those results look like they have potential. Heard a lot about the 20% flipper but never really bothered to look at it in detail. A question for you: the 20% from a low entry—is that from a pivot point; that is are you looking for downtrends that have pivoted (bounced up) by 20%? This is very different from a simple 20% increase.

@MovingAverage it's not as simple Nick makes it out to be - as there is ambiguity about what constitutes a low. What I've done is use the percentage of the ROC of the close for one week prior & which has to be greater than the percentage of the uptrend.

This is important
The "Buy" condition uses an alternate zigzag Function avoiding the problem with Amibroker built-in function. The function is then used within looping to include the variety of stops I have.

Read here

Some alternate zigzag codes
https://forum.amibroker.com/t/fast-afl-code-for-zigzag-based-on-price-change-anyone/20513/28
https://forum.amibroker.com/t/zigzag-atr-vs-percentage/21078

Summary
I believe it's worth the effort for those looking at a simple trend trading strategy. The results are pleasing & I'm sure the strategy can be improved.

Skate.
 
Whenever someone mentions Zig Zag and building a trading system around it, i get a cup of coffee because i know it's going to be messy.

I've uploaded a video that shows in realtime what happens with Ed Pottaschs formula. You can see that the turning points MOVE in time as the graph is scrolled. He plots lines to the high highs and the low lows, which is what Zig Zag's do. There's also a point in the video where the line starts heading down drastically a few days before the price heads down.

Not saying that it can't be used, but make sure you test it and use it with caution !!!
 

Attachments

  • Amibroker - [Gc-2021Z - Gold December 2021 - Daily] 2021-12-29 10-00-20-1.mp4
    954.4 KB
Whenever someone mentions Zig Zag and building a trading system around it, i get a cup of coffee because i know it's going to be messy.

I've uploaded a video that shows in realtime what happens with Ed Pottaschs formula. You can see that the turning points MOVE in time as the graph is scrolled. He plots lines to the high highs and the low lows, which is what Zig Zag's do. There's also a point in the video where the line starts heading down drastically a few days before the price heads down.

Not saying that it can't be used, but make sure you test it and use it with caution !!!
One of the zigzag system i tried now a couple of years ago ...and so as i was very green , was actually future looking.in a nasty not fully understood to this day way.
was not the AB zigzag but still faulty ...
So got burn..but probably worthwhile reviewing again now that i have greyer hairs
 
Whenever someone mentions Zig Zag and building a trading system around it, i get a cup of coffee because i know it's going to be messy.

I've uploaded a video that shows in realtime what happens with Ed Pottaschs formula. You can see that the turning points MOVE in time as the graph is scrolled. He plots lines to the high highs and the low lows, which is what Zig Zag's do. There's also a point in the video where the line starts heading down drastically a few days before the price heads down.

Not saying that it can't be used, but make sure you test it and use it with caution !!!
Lets talk about the ZiGZag Indicator
There has been discussions about how to use a ZigZag indicator correctly. @captain black often spoke of the ZigZag function for use in the development of his systems & went to great lengths to explain the ZigZag function should never used in a trading strategy because the signals keep repainting when more data is received. (Football analogy - the goal posts keep shifting with additional data)
Important drawback of the ZigZag indicator
The ZigZag function looks into the future & of course, should never be used for trading with real money
. It's okay to use the ZigZag function in your strategy development phase - use it as a guide to how accurate your signal are in relationship to the pivot points.

Summary
1. I don't use the ZigZag indicator in my Flipper Strategy.
2. The ZigZag indicator repaints as @DaveDaGr8 have explained with a visual.
3. Do not trade using the ZigZag indicator.

Skate.
 
@MovingAverage it's not as simple Nick makes it out to be - as there is ambiguity about what constitutes a low. What I've done is use the percentage of the ROC of the close for one week prior & which has to be greater than the percentage of the uptrend.
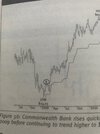
After spending an hour or so rummaging through my boxes of old trading books I found my copy of Unholy Grails. Seems like he's looking for a 20% rebound (pivot) off a down trend--pic below illustrates an entry of the flipper. Not having thought too hard about it but might make an interesting coding challenge to get that in AB. As @DaveDaGr8 pointed out--I too usually reach for a coffee when seeing the use of ZigZag. Personally I stay well clear of ZigZag in AB as it is loaded with potential "errors".


flipper.jpg
 
My definition of happiness is ‘desiring’ what you have !!

Thinking out loud waiting for the markets to open
The true secret of happiness is not found in seeking more, but in developing a capacity to enjoy less. Happiness & contentment are both in short supply these days.

The secret to keeping frustration in check is acceptance
Acceptance is making the best out of everything that happens. Whatever life throws your way, you have to embrace it, challenges make your life so exciting & without them, you wouldn't be the person you are today.

So much of life is out of our control
But we can control how we feel by changing our expectations. So never let our happiness hinge on what we can't control. We are all just passing through this life, experiencing a very unique & personal journey, a journey we only get to experience once. Accepting that there will be speedbumps along the way is just a fact of life.

Skate.
 
Skate's Flying Bat Logo.jpg

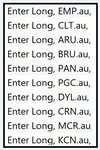
The raw signals for this week

RAW Signals.jpg

The Flying Bat Strategy - overview
It's a simple strategy that uses a few indicators to sharpen both the entry & exit signals. As the strength of a trend is so important in filtering out false signals, I've decided to use the "RSI, StochD & MACD" indicators in "combination" to return the best bang-for-buck. Those three indicators are at the very heart of everything this strategy hopes to achieve. The premise behind the idea is simple. Enter on a confirmed trend with strength & get out when strength fails to keep building. At times it can be slow to accumulate positions as it's very selective. This strategy has a complex exit strategy that incorporates a "take profit stop".

"The Flying Bat Strategy" began trading yesterday 29th December 2021
I had planned to start the Flying Bat Strategy from the 4th January 2022 but with the short week this week, I decided to bring it forward a few days.

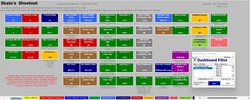
Shootout "The Platinum Strategy versus The Bat Strategy"
This shootout should provide a good "side-by-side" comparison with "The Platinum Strategy". The two strategies are completely different in construction. "The Platinum Strategy" suits the more cautious trader whereas "The Bat Strategy" is in for the long haul.

1. "The Platinum Strategy" gets into positions quickly & gets out of positions just as quickly.
2. "The Bat Strategy" is more of a growth strategy & very selective in getting into a position with extra time given to prove with itself.

Collation of strategies
As "The Platinum Strategy" was in 100% cash before this week's signals it's a perfect time for both strategies to start off with a fresh slate for a direct comparison. This project will go through until the 30th June 2022 to sort out the winner. A short 6-month shootout will at least give an indication of how both strategies perform. It's pure indulgence on my part. No matter what the markets do in this 6-month period I'm sure one of the strategies will shine.

Skate.
 
So that brings Q2 for FY22 to a close. So here's a snap shot of the performance of my three live systems from 1 July 2021.

First up is my weekly system. Since 1 July through to 31 Dec this system has gained around 10.7%. Below shows the systems performance with reference to unit price. As you can see performance of this system flatlined through the period early Oct to around mid Nov, after which the system experienced about a 7-10% drawdown. In the past week or so the systems performance has started to improve slightly.

Weekly Q2.JPG

Next is my EOD system. Since 1 July through to 31 Dec this system has only gained around 3.8%. This system had a reasonable Q1 FY22 but struggled to get any serious upward traction in Q2. Unlike my weekly which closed out a lot of its open positions my EOD has not experienced much trade activity and has remained around 80 to 90% invested. This system is more focused on big cap stocks delivering dividends so not surprised but its ordinary growth, but this performance doesn't include dividends for which there have been. About 90% of this system's open positions have been in the green since 1 July so it remains a relatively low risk system.

EOD Q2.JPG

Finally my swing system. In Q2 of FY22 it started to find some traction and while it didn't execute many trades it has gained around 6.6% during 1 July to 31 Dec. Most of this gain was put on during the last few months.

Swing Q2.JPG

Enjoy your new year everyone.

Stay classy ASF.
 
Top