Australian (ASX) Stock Market Forum

Dump it Here

You know humans code those systems, right?
the human who codes is not shaking in its boots nor dribbling with envy, moreover, most of the big boys use AI and qant who are looking at each other inputs etc, none of these human as it is played within ms much faster than any human responses.especially for the Big blue caps
Anyway, we agree to disagree . good luck and we will see where we stand in 10y time
 
What the hell
Your results from 1992 are okay, this year the results are dismal. Why?

I'm suggesting
Since the COVID Flash-Crash, all trading strategies need to be re-evaluated, that's all. A strategy that worked years ago may not be suitable for trading with the conditions were are experiencing at the moment.

I'm saying, something has changed!
Also, we have an enormous amount of new trading participants who are looking for a quick way of getting rich. With the new participants & their way of trading has certainly altered the markets "in a way" that we can take advantage of.

Cam combined 1992.jpg

Skate.
 
"Skate's Monthly Momentum Strategy"
This strategy has been systematically coded for robustness "trading volatile markets" since the (COVID Flash-Crash).

For transparency
Portfolio size: $100k
Position Size: 10
Index: ASX All Ordinaries

(a) 1/1/2021 to Now (11 months)
(b) 1/1/2020 to Now (1 year & 11 months)
(c) 1/1/2016 to Now (5 years & 11 months)
(d) 1/1/1992 to Now

Ascending date order
(a) 1/1/2021 to Now (11 months)

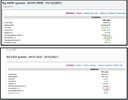
1-1-2021 to now.jpg


Portfolio Signals
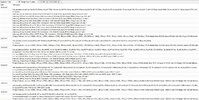
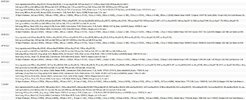
For full transparency, these are the signals for this calendar year.

1-1-2021 to now Positions Taken.jpg
1-1-2021 to now Positions Taken2.jpg

Skate.
 
"Skate's Monthly Momentum Strategy"
This strategy has been systematically coded for robustness "trading volatile markets" since the (COVID Flash-Crash).

I'm saying, something has changed!
The enormous amount of new traders has certainly altered the markets. A strategy that has been systematically coded to trade since (COVID) may not work as designed back in the days gone by.
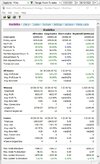
Phil 2 Comparisons.jpg

Say no more
The exposure back in 1992 compared to 2021 is stark. The results are reflective of this. Phew, this brings me to an end.

Skate.
 
"Skate's Monthly Momentum Strategy"
This strategy has been systematically coded for robustness "trading volatile markets" since the (COVID Flash-Crash).

I'm saying, something has changed!
The enormous amount of new traders has certainly altered the markets. A strategy that has been systematically coded to trade since (COVID) may not work as designed back in the days gone by.
View attachment 133613

Say no more
The exposure back in 1992 compared to 2021 is stark. The results are reflective of this. Phew, this brings me to an end.

Skate.
@Cam019 19, I also suspect that most systems are using a minimum price and amount traded per day in your buy filter??
as such since 1992, prices have jumped by 2 just with inflation (and not even thinking PE)


in USD but similar here:
"The dollar had an average inflation rate of 2.37% per year between 1992 and today, producing a cumulative price increase of 97.14%"
so I assume you have a variable in your backtests with is a ratio applied in your backtest to all hardcoded such figures,
doable but I somehow doubt it is done? otherwise, what is the point .
If not, maybe I have helped you there:
if I was to believe the 1992 onward backtests were useful:
which I am not :) , that is the very minimum change I would do to my code,
the mandatory use of relevant indexed $ values
 
@Cam019, you're not listening, you have a "closed mind". Just have an "open mind" of what I'm saying & displaying.

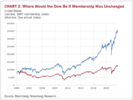
Let me show you a graph. "SOMETHING HAS CHANGED"
The recent inflows to equities exceed the combined inflow of the past 19 years. I would say something is different, something has changed over the last few years. What about the investment in "Bitcoin" over the last few years. The value invested in bitcoins was $742.3 billion as of July 29, 2021, & it's even more today.

Trading is different from years gone by
I would say something is different, something has changed over the last few years.

View attachment 133594

I'll post the other backtest reports to complete the series.

Skate.

Holy Frack......!
That inflows graph shows a pretty stark change.

On backtesting, does anyone here use the Amibroker Walk Forward functions in the their backtests?
 
What I'm saying is - I don't believe that optimising a systems parameters over a short window of time will hold up when running a long term backtest on historical constituent data. So, I am asking anyone who is game, post up your short term optimised strategies performance over the long term. If you do - great. If you don't - great.
Bit like flipping a coin twice and on both coin flips it comes up tails....then making the ridiculous assumption that for any coin flip you will have a 100% chance of getting a tails. A lot of people here really struggle with the basic concept of applying sample size and statistical relevance to their backtesting.
 
Phil 2 Comparisons.jpg


Say no more
The exposure back in 1992 compared to 2021 is stark.

It kind of shocks me that someone hasn't mentioned this, so I will.

You have basically proved my point about robustlessness.

The reason you have such low exposure with a long-term backtest is because the signals you have data mined for, and curve fitted to approximately 2 years of post "COVID Flash-Crash" data, didn't exist very often throughout the whole data set from 1992/1993.

So, what is going to happen when the markets change again and you need to curve fit your system after the next unforseeable market crash?

How do you know exactly when will be the next optimal time to 'curve-fit' your system'?

This strategy has been systematically coded for robustness "trading volatile markets" since the (COVID Flash-Crash).

You're trying to tell me that your system has been "coded for robustness" on a 37 trade sample size from 01/01/2020? Give me a break!
 
Last edited:
Bit like flipping a coin twice and on both coin flips it comes up tails....then making the ridiculous assumption that for any coin flip you will have a 100% chance of getting a tails. A lot of people here really struggle with the basic concept of applying sample size and statistical relevance to their backtesting.
we can stress relevance too :)
 
"Past success does not guarantee future performance."
You'll see this warning tacked onto everything from those wishing to sell you something trade-related. So why is it there, & what exactly does it mean?

Trading involves risk
Trading is a risky process that centres around the process of making good decisions & managing risk. With systemic traders, it is about the methodology & process that counts. Past results can be helpful when analysing a strategy, as long as the time horizon is meaningful "to you". Also, the past returns can be a helpful metric when choosing to evaluate a strategy further. A signal backtest is not an evaluation.

A sound trading plan with a good strategy works!
Much of the time, some traders (well most) are driven by their emotions, & these traders are the ones that cause prices to "rise & fall". More often than not, they trade at the wrong times, letting their "emotions" control their decisions. They buy more during rallies & sell more during slumps. If there appears to be a downward trend on the horizon, many begin to panic. If you're trying to build wealth, that is a losing strategy.

Skate.
 
So just looking at some of the comments made recently. One proviso is that these comments may well be made in the context of the ASX.

My comments are in relation to the S&P500:

Screen Shot 2021-12-01 at 1.33.41 PM.png
Screen Shot 2021-12-01 at 12.44.48 PM.pngScreen Shot 2021-12-01 at 12.45.12 PM.pngScreen Shot 2021-12-01 at 12.48.11 PM.png

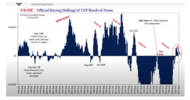
1. Something that has changed in (stock) markets: the greater involvement of Central Banks (manipulation of short end of curve, QE and direct purchases of securities) in 'supporting markets'.

2. The nature of participants involvement, ie. Options:

3. Constituents of various indices being replaced. Relevant if indices are being traded.

Screen Shot 2021-12-01 at 1.49.59 PM.png

4. Flows of international debt:

Screen Shot 2021-12-01 at 1.48.08 PM.png

5. Re. the 'law of large numbers' and statistical relevance; markets are not the correct milieu to rely upon statistical measures.

jog on
duc
 
This is a genuine question, but when I say "statistically relevant" what do people think that means? @ducati916 point 5 above makes me think people have very different definitions what what it means because @ducati916 reference is definitely at odds.
 
This is a genuine question, but when I say "statistically relevant" what do people think that means? @ducati916 point 5 above makes me think people have very different definitions what what it means because @ducati916 reference is definitely at odds.
Okay, so the two things I would look at are sample size of the backtest and the number of optimizable variables in the system.

The more optimizable variables in your system, the larger the sample size you are going to require to understand whether there is an actual 'edge' created by trading the system with the parameters that have been chosen. The lower the sample size (and the more optimizable variables in your system) the more likely there is nothing other than a random chance relationship of the chosen parameters over the backtested period.

I like to use a rough guide which I found here a while back.

Backtest sample size = 50 + (50 * number of optimizable variables in the system)

I have 5 optimizable variables in my system, including position sizing, so therefore I want to have a bare minimum sample size of 300 trades. For my system, this means I would have to backtest from 01/01/2006 to 31/12/2021 to get my minimum required sample size. I get 301 trades for this period.

My personal preference is to go back as far as the data allows me to - 1992/1993.
 
Top