Australian (ASX) Stock Market Forum

Dump it Here

Summary
I've never found "fundamental analysis" to be all that helpful, but that's just me. Also, I wouldn't have the time or skill to trade like @peter2 or @frugal.rock. that's for sure.

Skate.
See @Skate I'm not suggesting to trade on fundamentals....that's not me either. What I am suggesting is that instead of using market cap as the basis for defining the universe of stocks to trade your system....maybe apply other criteria such as EPS, PE or the others I mentioned to define your system's universe. Most system traders are using market cap to trade their systems so why not use some other metric to define your system's universe. Trading on fundamentals and defining a universe based on fundamentals are two very different things and should not be confused.
 
See @Skate I'm not suggesting to trade on fundamentals....that's not me either. What I am suggesting is that instead of using market cap as the basis for defining the universe of stocks to trade your system....maybe apply other criteria such as EPS, PE or the others I mentioned to define your system's universe. Most system traders are using market cap to trade their systems so why not use some other metric to define your system's universe. Trading on fundamentals and defining a universe based on fundamentals are two very different things and should not be confused.
Interesting. For a while now I've been of the belief that in order to make a difference, or get that extra edge, you have to be different.

The way I've gone with my systems is using the Chi-X 200 index as my base. Even though most stocks are the same as the S&P 200 index, the Chi-X version contains more Australian stocks. That's how I'm implementing this 'difference' to try to get an extra edge.

Creating a universe based on something other than prices is certainly one way of being different. Maybe if @Skate doesn't implement this, then hopefully it will give someone else the idea of doing the same thing.

KH
Fully agree, having a different realm distinguish you from the pack and can be an advantage.2 of my systems are indeed not using asx or all ord.and are kind of ok
 
Interesting. For a while now I've been of the belief that in order to make a difference, or get that extra edge, you have to be different.

The way I've gone with my systems is using the Chi-X 200 index as my base. Even though most stocks are the same as the S&P 200 index, the Chi-X version contains more Australian stocks. That's how I'm implementing this 'difference' to try to get an extra edge.

Creating a universe based on something other than prices is certainly one way of being different. Maybe if @Skate doesn't implement this, then hopefully it will give someone else the idea of doing the same thing.

KH
What is the chix index code? I am lazy..?
 
Interesting. For a while now I've been of the belief that in order to make a difference, or get that extra edge, you have to be different.

The way I've gone with my systems is using the Chi-X 200 index as my base. Even though most stocks are the same as the S&P 200 index, the Chi-X version contains more Australian stocks. That's how I'm implementing this 'difference' to try to get an extra edge.

Creating a universe based on something other than prices is certainly one way of being different. Maybe if @Skate doesn't implement this, then hopefully it will give someone else the idea of doing the same thing.

KH
Agree, need to think differently to improve your edge.

Wasn't suggesting @Skate do the coding for us (he has enough of his own research going on)--was only mentioning it in case it was of interest. It's actually very easy to code in AB so going to do some sims myself. Plan to initially look into applying my systems to a universe of stocks that have a PE within a certain band and as another approach create a universe based on EPS being above a certain threshold. Will post up first cut of sim results over the weekend.
Yes, sorry if I implied that @Skate should be coding this. The interesting bit would be to see how various universes (say, for example, low debt, high dividends, or your two examples, and the like) would perform against each other.

As a confirmed "price watcher" and avid reader of such things, I would like to think that the same system using any of those universes would perform substantially the same, but somehow, I think not. It would be an interesting read.

KH

@KevinBB I hate to be the bearer of bad news but Norgate's fundamental data doesn't include historical data. Historical data would be a definite requirement for your research.

Norgate does not provide Historical Fundamental data
But in saying this it should be noted that their fundamental data has the most current reporting quarter. To obtain usable or relevant backtesting results you would need a "historical source" for your fundamental inputs of which Norgate, unfortunately, doesn't supply.

It's actually very easy to code in AB so going to do some sims myself. Plan to initially look into applying my systems to a universe of stocks that have a PE within a certain band and as another approach create a universe based on EPS being above a certain threshold.

@MovingAverage before you spend time on this project you'll need a different data source other than "Norgate Fundamental Data Set" as Norgate's historical data set is restricted to the current reporting quarter only. The ideas being promoted have merit but even with historical data, the evaluation would produce clunky results without achieving a solid metric to use. (IMHO)

Have a read here

Summary
The fundamental values from Norgate are current snapshots, & they are not a "time series" of historical data points that you'll require to do any type of research or evaluation.

Skate.
 
@KevinBB I hate to be the bearer of bad news but Norgate's fundamental data doesn't include historical data. Historical data would be a definite requirement for your research.

Norgate does not provide Historical Fundamental data
But in saying this it should be noted that their fundamental data has the most current reporting quarter. To obtain usable or relevant backtesting results you would need a "historical source" for your fundamental inputs of which Norgate, unfortunately, doesn't supply.


@MovingAverage before you spend time on this project you'll need a different data source other than "Norgate Fundamental Data Set" as Norgate's historical data set is restricted to the current reporting quarter only. The ideas being promoted have merit but even with historical data, the evaluation would produce clunky results without achieving a solid metric to use. (IMHO)

Have a read here

Summary
The fundamental values from Norgate are current snapshots, & they are not a "time series" of historical data points that you'll require to do any type of research or evaluation.

Skate.
Agree, for some fundamental data. But if memory serves me correctly some of the fundamental data can be found (calculated) for historical data. I need to dig up Trav's original posts on this but I pretty certain he graphed some of the historical data over time in AB. I'll dig up Trav's post on this and post a link here.
 
This fundamental data comes with Norgate's premium data and is extremely interesting and I think has some potential opportunities for us system traders. As we all know it is very common for system traders to adopt a simplistic approach of applying their systems to a particular index (e.g., ASX200), which is nothing more than targeting your system to stocks of a certain market cap.
My review of the Norgate fundamental data is that much of it is current data, not historic time series data. You could possibly use it for live trading, but without the time series data you couldn't backtest the system. If you investigate the Norgate fundamental data yourself be sure to differentiate between current only vs. time series data. I'm happy to be proven wrong here.

One exception is dividend data, which is time series, but of course not continuous data.

Edit: I posted before reading the entire thread.

You're spot on @Linus van Pelt
 
The Platinum Strategy.jpg

Amibroker is a programmable scientific calculator nothing more & nothing less.

Irritating example
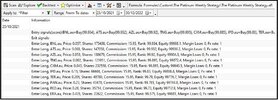
"The Platinum Strategy" Backtest "buy signals" before Monday's open is listed below. You will notice that the signals at this stage are "irrelevant" & "inaccurate" because the signals are taken using the last bar open to do the maths.

Backtest Capture.JPG

Amibroker recalculates after the open
After Monday's open "Amibroker will recalculate" those numbers (price & shares) once the opening price is known. Amibroker uses the last open to calculate the share price & the number of shares to buy in the "Backtest Report" is "irrelevant" & "an inaccurate assumption" at this stage.

Recalculations after Monday's open
"The Platinum Strategy" Backtest buy signals are recalculated "after" Monday's open because now it uses the last bar (Monday's bar). Because Amibroker is a programmable scientific calculator the (Pad & Align) feature fills missing data so the recalculations can be made.

After the open Screenshot 2021-10-27 094951.png

Exploration Analysis is not equal to a Backtest Report
Exploration outputs (raw) signals & a Backtest outputs trading simulation results.

BTW
IPD has been in a "trading halt" before Monday's open yet Amibroker Backtest includes the position as a member of the portfolio.

Why is this important?
Because using the Backtest to generate buy signals instead of the Exploration Analysis, the Backtest will not generate another buy position to compensate for the position (IPD) not taken because of the trading halt. If anyone has a coding idea to rectify this, "I'm all ears"

The only alternative
In the future, I'll output all the raw signals using an Exploration Analysis & select from the top-down "as they are ranked" only the number of positions required to fill the 10 position portfolio.

Skate.
 
I've never discussed the working of my "StaleStop" exit strategy
My trading portfolio is large to me (over $2.6m) & drawdown percentages become "irrelevant" when handling large sums. A 20% drawdown on a $20k is acceptable but not on $2.6m. The drawdown needs to be controlled at all costs without reducing the profit potential of any of my strategies.
This is a major peeve of mine--people often say "it's only a 20% drawdown, not a big issue...i can deal with that". In my experience when folks are live trading they generally don't think in terms of %...they think in terms of absolute $$$$ amount. So as you say 20% on 20k is 4k not a big deal, but 20% on 2.6 mill...$520,000....that's a lot of money. The reality of trading, however, is that you cannot reduce drawdown without also reducing profit....risk/reward. drawdown = risk
 
If anyone has a coding idea to rectify this, "I'm all ears"

I'm just throwing this idea out - you'll have to further research it. I don't know all the details of your strategy, so this may not apply.

IIRC, you have Norgate data.

My understanding is that, when Amibroker pads and aligns, it just copies the last OHLCV data "wholus-bolus" to the missing bar. I've heard some folks consider this stupid, since of course there was no volume on the days it didn't trade. Although of course volume may need to be carried forward for certain derivations such as liquidity. Then again, I would argue that this would distort a liquidity derivation, since it most certainly wasn't liquid on days it didn't trade.

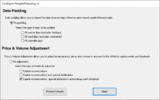
Norgate pads differently, copying C to OHLC of the missing bar, but leaves V empty. Furthermore, it provides a time series function letting you know when the bar was padded.

Here is a screenshot with No Padding in Norgate:

1635326220978.png

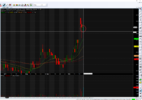
1635326418194.png

The green bar is Friday, the next bar is Weds.

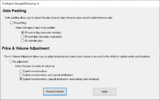
Here is a screenshot with padding turned on in Norgate:

1635326494182.png

1635326698334.png

If you select IPD as your active chart, open a new AFL window, enter this code:

// Norgate Data Functions
#include_once <..\Norgate Data\Norgate Data Functions.afl>;

Padding=NorgatePaddingStatusTimeSeries();

x=0;

Put a breakpoint on x=0 (it has to be an executable line), and add O, H, L, C, V, and Padding as watched variables. Execute up to the breakpoint, and click the Arrays tab

(I'm sure you know all this, this is for those who read this post later and may be new to Amibroker).

Here is a screenshot:

1635327045169.png

So, in summary, compare Amibroker's Pad and Align vs. Norgate's padding, and check your strategy's performance using both approaches. If it still performs well using Norgate's padding, then you can add a condition to your buy rule "... AND NorgatePaddingStatusTimeSeries() == 0" so your system doesn't try to buy on padded days. Then, when the symbol is no longer padded and meets the rest of your buy conditions (including PositionScore etc), the backtest should buy it since it was not already an open position.

Finally, see https://norgatedata.com/amibroker-faq.php, search on "My trading system gives anomalous results when using AmiBroker's Pad & Align setting. How do I fix this?"

Hope this helps...
 
(I'm sure you know all this, this is for those who read this post later and may be new to Amibroker).
For those following along
@Linus van Pelt is absolutely correct with his description of how Norgate pads differently to Amibroker. Using Norgate custom "pad" feature the empty bar is "padded" with the "Closing price" only, whereas Amibroker pads the data using "OHLC" from the previous bar.

Sample [ASX - IPD] placed in the pre-auction (CommSec)
1. The position is only "Good for a Day" & will automatically be "cancel" if the position is not executed on the day.
Unfortunately, it's not a fix
Why? because when the next bar receives current data, Amibroker simply recalculates the "buy position" using the most recent bar that has the "opening price" for its recalculations. Trading Halts always last longer than a day & my buy positions are only "good for a day".

Skate.
 
For those following along
@Linus van Pelt is absolutely correct with his description of how Norgate pads differently to Amibroker. Using Norgate custom "pad" feature the empty bar is "padded" with the "Closing price" only, whereas Amibroker pads the data using "OHLC" from the previous bar.


Unfortunately, it's not a fix
Why? because when the next bar receives current data, Amibroker simply recalculates the "buy position" using the most recent bar that has the "opening price" for its recalculations. Trading Halts always last longer than a day & my buy positions are only "good for a day".

Skate.
getting ready for volatility and trading halts is not easy, I ramped up a minimum SP lately on one system, but daily systems do not like this environment indeed with huge paper swings and frequent stop buys
 
Top