Australian (ASX) Stock Market Forum

Dump it Here

what do you mean?lowest in price ? or lowest correlated, in that case something like GEAR VS BEAR,, should always move opposite?
as you play in the ASX
Not being a smart arse here frog....but GEAR and BEAR are highly correlated. The fact they move in different directions doesn't really factor into the question of correlation. The reality is when one of those move in one direction the other will absolutely move in the opposite direction and so their movement is "joined at the hip"--highly correlated.
 
Despite the recent sideways movement my index filter has remained on. My weekly and EOD breakout have been fully invested for some time. July didn’t see too many exits or new positions so systems have been pretty steady

me too! i've been surprised that my systems are still turned on. both for weekly and daily. PL pretty steady or stagnant. a little frustrating right now actually. monthly is the only one doing really well.
 
Have a look at asxcorrelations.com.

For the ASX20, it looks like NCM and MQG have the closest correlation to zero.

But, be aware, the Aussie stock market is a funny beast mainly because of the large dividend payouts. I'm not sure if this web site back adjusts prices for past dividends.

KH
Interesting site. Do you have any association with the website? Only ask as I'd like to know a little more about what's "under the hood"
 
Thanks @KevinBB

I’ll take a look.

I’m just looking for some shares with the highest negative correlations (nothing to do with share prices). Maybe a way to hedge an options strategy between different negatively correlated shares.

Gunnerguy
 
Interesting site. Do you have any association with the website? Only ask as I'd like to know a little more about what's "under the hood"
Hi.

No association at all. I'm just a retired bloke, private investor, with a reasonable knowledge of mathematics and the markets. I didn't know about that site until Google told me.

That's why the caveat about prices and dividend adjustments. I doubt very much that the site adjusts prices for dividends, because no other analysis site I've seen does that. Its something that most people don't realise when running standard tests on prices of ASX stocks.

Edit: I should have added that its possible to calculate those correlations relatively easily using Python and Pandas. My interests are mainly in automated trading of the US Futures markets, and part of my software does those calculations. I haven't yet tried it on ASX stocks, mainly because of the costs of trading Au as opposed to the US.

KH
 
Not being a smart arse here frog....but GEAR and BEAR are highly correlated. The fact they move in different directions doesn't really factor into the question of correlation. The reality is when one of those move in one direction the other will absolutely move in the opposite direction and so their movement is "joined at the hip"--highly correlated.
Ok, yes. But i thought the idea was opposite, not going in the same way?
So yes gear and bear are inversely correlated by design ?
 
Not being a smart arse here frog....but GEAR and BEAR are highly correlated. The fact they move in different directions doesn't really factor into the question of correlation. The reality is when one of those move in one direction the other will absolutely move in the opposite direction and so their movement is "joined at the hip"--highly correlated.
I think that might be what is meant by inverse correlation as opposed to correlation.

Edit: Just realised the frog has already pointed this out. Please forgive my hasty intrusion.
 
I think that might be what is meant by inverse correlation as opposed to correlation.

Edit: Just realised the frog has already pointed this out. Please forgive my hasty intrusion.

It's negative correlation (prices move in opposite directions but are correlated) as apposed to positive correlation where the prices move in the same direction. I use correlation in the general sense in which a move in one stock will influence a move in another stock.
 
PM:
as you will remember from among others Mr Ducati (@ducati916 ), not all paper gold and PM are born equal;
And many do not actually match any owned PM.
Mr Duc recommends the US listed PSLV (physical silver)
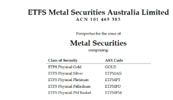
here in Australia, we have a valuable access to supposedly real PM backed codes:
obviously the local PMGold
but also:
1627946796834.png
https://cdn-api.markitdigital.com/a...access_token=83ff96335c2d45a094df02a206a39ff4

If anyone knows otherwise, please tell us, but I believe PMGOLD and the 5 above listed tickers are physically backed.
Hope it helps avoiding too much overniht digging in Mrs Frogette garden, and save the neighbours sleep as well, as I am switching the hand shovel for the 4in1 bucket lately :)
 
Just a quick shout out to you guys on what a worthwhile thread this is. I do pop in every few weeks to see whats happening, see anything of interest and do pick the odd thing/idea up. I think skate started the thread and deserves to be commended for it.

off the top of my head I've picked up an idea on pocket pivots which I've since developed and deployed, its doing great. also obtained some comfort in hearing of the struggles in june/july that I can certainly relate to. My portfolio of systems had a great fy21 but june, july were much tougher, down 0.8 and 0.2%, so not disastrous by any means but below indices/benchmarks. as someone commented, its the choppy and bear markets that tests a traders mettle. As always in times of underperformance, one questions why. I like to track the rolling 20, 40 ,60 trade win% as an indicator of system performance and I could certainly see drops in these measures during this period but within expectation. So that, market assessment of choppy conditions and trade reviews provided reassurance just to keep ploughing on. also enjoyed the discussion on mc and excel, rt, etc, things I might look into.

so again thankyou for a great thread. you have a great community here.
 
Couldn't help but notice the tumble weed blowing through the Dump It Here thread, so thought I might post something.

Well the first quarter of the financial year is done and dusted so just thought I'd dump this quarter's performance of my live systems, which is for 1 July thought to 30 Sept.

First up is my weekly system. The Sept quarter certainly was volatile for my weekly system. It was up and down through July and Aug and the overall unit price of my weekly just moved sideways. However, September saw my weekly really get moving upwardly. Over all my weekly system put on 10.67% for the July-Sept quarter, which I'm reasonably happy about. September delivered about half of the quarters 10.67% gain. Going into July my weekly was pretty much 100% invested, but as we hit the end of August a number of the positions were closed out so the system ended up around 60% invested at 30 September.

Weekly Sep Quarter.JPG

As for my EOD system, it certainly didn't encounter the volatility that my weekly experienced. July was a bit of a flat month, but it certainly found traction through August seeing some good gains. Unfortunately, September wasn't so good for my EOD as it wiped out some of July's gains. Overall, my EOD system delivered a gain of 3.35% for the July - September quarter. My EOD system remained fully invested through the quarter.

EOD September Quarter.JPG

Finally, my swing system had a reasonable start to the quarter putting on some okay gains from July to around mid-August. Unfortunately it was all downhill from then to end of September. For the quarter my swing system delivered a gain of around 2%.

Swing September Quarter.JPG

Stay classy ASF.
 
Couldn't help but notice the tumble weed blowing through the Dump It Here thread, so thought I might post something.

Well the first quarter of the financial year is done and dusted so just thought I'd dump this quarter's performance of my live systems, which is for 1 July thought to 30 Sept.

First up is my weekly system. The Sept quarter certainly was volatile for my weekly system. It was up and down through July and Aug and the overall unit price of my weekly just moved sideways. However, September saw my weekly really get moving upwardly. Over all my weekly system put on 10.67% for the July-Sept quarter, which I'm reasonably happy about. September delivered about half of the quarters 10.67% gain. Going into July my weekly was pretty much 100% invested, but as we hit the end of August a number of the positions were closed out so the system ended up around 60% invested at 30 September.

View attachment 130900

As for my EOD system, it certainly didn't encounter the volatility that my weekly experienced. July was a bit of a flat month, but it certainly found traction through August seeing some good gains. Unfortunately, September wasn't so good for my EOD as it wiped out some of July's gains. Overall, my EOD system delivered a gain of 3.35% for the July - September quarter. My EOD system remained fully invested through the quarter.

View attachment 130901

Finally, my swing system had a reasonable start to the quarter putting on some okay gains from July to around mid-August. Unfortunately it was all downhill from then to end of September. For the quarter my swing system delivered a gain of around 2%.

View attachment 130902

Stay classy ASF.
Well done for your weekly systems especially in the 2 last weesk where mine got hammered.
I noticed you ended 60% invested so must have entered an entry freeze earlier .Good strategy
 
I've been itching to start another strategy
After reading @peter2 & @qldfrog weekly trading results (which vary considerably, I must say) have prompted me to "throw my hat into the ring" to display another way of trading or to be "more accurate" my way of trading. As of Monday, I'll start trading a new strategy. I'll be posting my signals & ongoing weekly results with a few previous backtest results thrown in for those who want to follow along.

The Platinum Weekly Strategy
This strategy will be a $100k, 10 position portfolio.

Parameter Settings
Also for full disclosure, I'll post the parameter setting of "The Platinum Strategy". The strategy is nothing fancy but it's certainly robust.

Norgate's “Platinum subscription”
I've bitten the bullet & subscribed to Norgate's "Platinum Subscription" that makes use of Historical Index Constituents checking that the security was in the relevant index at the time the trade was entered. (Posted Backtests should now accurately reflect trading results)

Skate.
 
Trading is a hard slog (at the moment)
Because of this, it raises a few questions:
(a) What's been happening with trading lately?
(b) What is the measure to accurately evaluate how effective a strategy is?
(c) What style of trading will generate the most effective return for the least amount of risk?

These are very important questions
Statistics are one thing but as a trader, you should be more interested in what will help you improve the consistency of your trading. "Hickle pickle" trading just won't cut it "trading in these times".

Skate.
 
Robust trading systems
As a system trader, it's all about building a robust (as opposed to optimal) trading strategy that can withstand multiple outcomes. Since "COVID-19" trading has somewhat changed in as much that profits can “dissolve” so quickly that has to be addressed. Without adapting I'm positive "frustration" will eventually lead to faulty thinking & poor results.

There are so many metrics
There is a multitude of metrics that can evaluate the performance of any trading system just goes to prove how swamped we are with an information overload. Even though you can use these metrics to select the best trading system for you, the criteria for selecting a system tends to be arbitrary. Metrics give an indication but don’t indicate which system is the best in terms of consistency with performance. (Trading is certainly a trade-off between the two)

Skate.
Nice to see you back Mr Skate.system trading is now a faily roller coster up down 6k a day quite often aka 2% up or down in a day. Heart attack stuff
 
Top