MovingAverage
Just a retail hack
- Joined
- 23 January 2010
- Posts
- 1,315
- Reactions
- 2,565
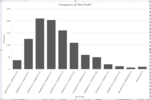
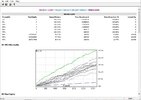
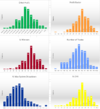
Yes, it might be helpful to have some sort of Excel template for this. In the past I've tended to just past backtest runs into Excel and do formulae to pull it together for something worth graphing. Can't find the spreadsheet where I experimenting with Stevo style output frequency histograms, but here is a fairly primitve set set of bar graphs when I was trying 10 runs with small % randomness built in to Buy while various Buy conditions where turned on or off (or optimized). This is for a single 10 run backtest. You'd need to run around 200 to get something approaching the steve plots in my post above of course.
Looking forward to future posts MA when you have time.
Agree there is value not only in increasing key parameters, but considering spread of possible values in your backtest universe - in real life you always tend to end up closer to the min value than max
View attachment 127832
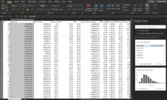
If you're using the latest version of Excel it has a great statistics plugin that has a lot of easy to use functions and analysis including histograms and important statistical analysis of those histograms. I have a colleague that uses it to generate some generalized models of his system (from the back test analysis) and then uses those generalized models in conjunction with his live trades to make sure the system is behaving itself. It's a great way to make alert yourself to system behavior that is out of the ordinary. I haven't got that far yet, but it is something I seriously want to do.

