Australian (ASX) Stock Market Forum

Dump it Here

definitely agree with you there. you need to define system rules in that respect as to what constitutes a reason to turn it off. there are some fantastic discretionary traders here who do the same thing as well, and if you follow there thread they perform amazingly. the point being that the decisions are still based on rules. i think new traders should be careful and have some rules about what would constitute certain market conditions.

not sure about the others here, but if i'm exploring some ideas i code up some ideas and see if the basic premise works. thats easy. the hard part is determine filters (market condition statements) to turn it on/off and striking a balance between being in the market to take advantage of any rebound and avoid being in a potentially downward market (or being exposed to unnecessary risk). you will sacrifice some profit to reduce your DD. it then becomes a balancing act of finding a level of risk you are comfortable with, but also having a profit that makes your time (and capital) worth it.

let me know if any of you perfect this balance. i'm still trying to figure it out, haha.
There is no perfect balance or a magic indicator that pinpoints the exact top to sell out of the market and exact bottom to get back in.

I personally don't use anything complicated. A longer term moving average or the crossover of shorter term moving averages is about as complex as I get to gauge the market direction.

During downturns, although there are no new buy trades placed on the market, company research doesn't stop. In fact I find it a productive time to spend time researching great companies as you'll be able to buy in at bargain prices once the bear market has discounted them.
 
definitely agree with you there. you need to define system rules in that respect as to what constitutes a reason to turn it off. there are some fantastic discretionary traders here who do the same thing as well, and if you follow there thread they perform amazingly. the point being that the decisions are still based on rules. i think new traders should be careful and have some rules about what would constitute certain market conditions.

not sure about the others here, but if i'm exploring some ideas i code up some ideas and see if the basic premise works. thats easy. the hard part is determine filters (market condition statements) to turn it on/off and striking a balance between being in the market to take advantage of any rebound and avoid being in a potentially downward market (or being exposed to unnecessary risk). you will sacrifice some profit to reduce your DD. it then becomes a balancing act of finding a level of risk you are comfortable with, but also having a profit that makes your time (and capital) worth it.

let me know if any of you perfect this balance. i'm still trying to figure it out, haha.
I’m not one for discretionary trading approaches—I don’t trust my discretion (and that isn’t a joke). There are some really smart ways of determining market conditions—a well known quant that I follow has a pretty cool approach that works very well. He basically has a long system and a short system (both of which have high W/L trade ratios. To determine market conditions he runs these systems and looks at the ratio of buy sells that are being generated by each system—he then basically turns systems on/off and directs capital based on the ratio between the two systems. It is important to note that the long and short systems in this cases are not being used for trades but instead used to select different underlying systems to trade and direct his capital. The point I’m trying to make is that you need to think a little different from just using a traditional market filter when it comes to a systematic approach to managing systems. There’s a whole body of research on system management and it certainly is food for thought.

I fully appreciate the link between profit and DD and that is very much one of personal acceptance—you and I (as with most other traders) probably have a different view on what is acceptable and that is ok because our investment outlooks and risk tolerances are probably very different.
 
There is no perfect balance or a magic indicator that pinpoints the exact top to sell out of the market and exact bottom to get back in.

I personally don't use anything complicated. A longer term moving average or the crossover of shorter term moving averages is about as complex as I get to gauge the market direction.

During downturns, although there are no new buy trades placed on the market, company research doesn't stop. In fact I find it a productive time to spend time researching great companies as you'll be able to buy in at bargain prices once the bear market has discounted them.
I think it was @Skate that made a post here not so long ago that was very simple but very important—basically, his post reminded us that close enough is good enough. So many times system traders get hung up searching for perfection and complete optimisation in their systems (hey, I’ve fallen into that trap). Sometimes, the simple things, while not perfect, get the job done.
 
I think it was @Skate that made a post here not so long ago that was very simple but very important—basically, his post reminded us that close enough is good enough. So many times system traders get hung up searching for perfection and complete optimisation in their systems (hey, I’ve fallen into that trap). Sometimes, the simple things, while not perfect, get the job done.

yea its a good point really. good enough is close enough. there is no perfect system, and searching for perfection will only make things worse. in trading, this is the over-optimisation, and/or meddling with your system constantly. both are horrible things to be doing.

I like simplicity in things. All of my trading systems have turned out to be very simple, and I hope relatively robust.
 
I think it was @Skate that made a post here not so long ago that was very simple but very important—basically, his post reminded us that close enough is good enough. So many times system traders get hung up searching for perfection and complete optimisation in their systems (hey, I’ve fallen into that trap). Sometimes, the simple things, while not perfect, get the job done.
Guilty as well...
 
Breakout systems are generally known for having a pretty average % of winning trades. This is often the result of breakouts turning into fake-outs. I live trade a breakout system so I am always looking at ways to improve the % of winning trades--the logic being that an increase in % winners will improve the top line results (this isn't always the case), but my experience shows that in some cases even a modest increase in % winning trades can yield a worthwhile increase in the topline performance. One of the system traders I follow was recently discussing general approaches to improving the % of winners in breakout systems and one of the indicators he mentioned in passing was the Volume Positive Negative (VPN). Some of his preliminary simulations were showing some interesting results so I thought I'd explore the VPN to see if it had potential to improve my live breakout system.

The Volume Positive Negative (VPN) Indicator

I'm not going to discuss the VPN in detail here, except to say that it is an oscillator that swings between -100 and +100 and in summary looks at the volume on up days and volume on down days and uses those volumes to crunch some numbers to arrive at a value for the oscillator. Want to know more about the VPN then check out this year's April edition of Technical Analysis of Stocks & Commodities.

How Did I Use the VPN in my System

For the purposes of testing the VPN I simply added it as one of my buy conditions. I maintained the normal entry conditions for my breakout system but the VPN was added as an additional condition and that was the VPN had to be above a certain threshold for the standard entry positions to be taken.

Buy = [normal system entry conditions] AND [VPN > Threshold Value]

I did some preliminary sims to evaluate 2 settings for the VPN, which were the VPN period and the VPN threshold. After running some sims I arrived at a VPN period of 2 and a VPN threshold of 40. Note: the period value of 2 and the threshold value of 40 were not chosen because they gave the best % profit on a single run, but instead chosen because they provided the most constant system returns on a range of out of sample data.

What Impact Did VPN Have on my System

After running some sims of my system with and without the VPN I have to say the VPN left me a little ambivalent about this indicator's benefits and I'm probably unlikely to invest much more time researching this indicator, but having said that I am going to run a few more sims to adjust other aspects of my system to see if they are holding back the potential of the VPN.

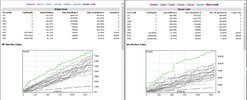
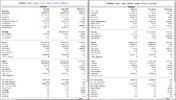
Anyway, here is the high level results of the system with and without the VPN (first chart below). The results below on the left are my system without the VPN and the results on the right are the system with the VPN. Overall, the VPN did improve the topline results with around a 43% increase in net profit. AB's MC analysis (second chart below) shows a bit more spread in the system's returns with the VPN, but not what I'd consider a really bad spread. Overall the MC shows that the VPN can deliver reasonable topline results. One of the main attractions to me initially with this indicator was to hopefully achieve an increase in winners, but the VPN only delivered a very marginal increase (almost nothing) of about 0.5%--no where enough to get me excited. The increase in net profit did seem to come with an increase in system DD (see third chart below) but that really only came about during the March Covid crash. Drawdowns prior to the Covid crash did seem to be slightly less in the system with the VPN.

Would I Use the VPN

While it was interesting to experiment with the VPN I will unlikely go much further with it. One of my primary objectives was to increase the % winners and the VPN doesn't deliver on that. The fact that the system with the VPN delivers less consecutive winners is also a bit of a turnoff for me. Anyway, if you're only chasing an improvement in topline returns then it might be wise for you to explore the VPN.

WITHOUT VPN (LEFT) WITH VPN(RIGHT)

VPN Results 1.JPG

MC WITHOUT VPN (LEFT) MC WITH VPN (RIGHT)

VPN Results 2.JPG

DD WITHOUT VPN (LEFT) DD WITH VPN (RIGHT)

VPN Results 3.JPG
 
Last edited:
Yeah simple is great.

Chances are if the system is too complex and has too many variations the trader will not follow through sooner or later.

I think that depends. I have a "complex" (but not to me) system that I believe in, so I follow it. I could create a "simple" system, but if I didn't believe in it I wouldn't trade it.

"the trader will not follow through sooner or later." I think that's more a statement about the trader than the system.
Complex systems require ironclad dedication and great discipline to stick to. If that can be done, the results could be quite rewarding.

I know if I too much pressure on myself, it's more likely I'll look for shortcuts and bypassing some key checkpoints in a system when things get hectic such as when there is a lot of work on or while I am taking a vacation. So I try to stick to trading that I can cope with and go into "monitoring existing trades" only mode when I can't dedicate the time and effort.
 
What’s the point of small trades of as low as 1 unit across a variety of stocks that could be valued from as little as .05c and upward.

I understand some maybe completing orders, however some sit or are initiated as next day opening bids at highest price seen for a stock in eons.

If again clearing orders is the reason why are they not cleared by the previous days end?

Any insights would be appreciated…..
 
Breakout systems are generally known for having a pretty average % of winning trades. This is often the result of breakouts turning into fake-outs. I live trade a breakout system so I am always looking at ways to improve the % of winning trades--the logic being that an increase in % winners will improve the top line results (this isn't always the case), but my experience shows that in some cases even a modest increase in % winning trades can yield a worthwhile increase in the topline performance. One of the system traders I follow was recently discussing general approaches to improving the % of winners in breakout systems and one of the indicators he mentioned in passing was the Volume Positive Negative (VPN). Some of his preliminary simulations were showing some interesting results so I thought I'd explore the VPN to see if it had potential to improve my live breakout system.

The Volume Positive Negative (VPN) Indicator

I'm not going to discuss the VPN in detail here, except to say that it is an oscillator that swings between -100 and +100 and in summary looks at the volume on up days and volume on down days and uses those volumes to crunch some numbers to arrive at a value for the oscillator. Want to know more about the VPN then check out this year's April edition of Technical Analysis of Stocks & Commodities.

How Did I Use the VPN in my System

For the purposes of testing the VPN I simply added it as one of my buy conditions. I maintained the normal entry conditions for my breakout system but the VPN was added as an additional condition and that was the VPN had to be above a certain threshold for the standard entry positions to be taken.

Buy = [normal system entry conditions] AND [VPN > Threshold Value]

I did some preliminary sims to evaluate 2 settings for the VPN, which were the VPN period and the VPN threshold. After running some sims I arrived at a VPN period of 2 and a VPN threshold of 40. Note: the period value of 2 and the threshold value of 40 were not chosen because they gave the best % profit on a single run, but instead chosen because they provided the most constant system returns on a range of out of sample data.

What Impact Did VPN Have on my System

After running some sims of my system with and without the VPN I have to say the VPN left me a little ambivalent about this indicator's benefits and I'm probably unlikely to invest much more time researching this indicator, but having said that I am going to run a few more sims to adjust other aspects of my system to see if they are holding back the potential of the VPN.

Anyway, here is the high level results of the system with and without the VPN (first chart below). The results below on the left are my system without the VPN and the results on the right are the system with the VPN. Overall, the VPN did improve the topline results with around a 43% increase in net profit. AB's MC analysis (second chart below) shows a bit more spread in the system's returns with the VPN, but not what I'd consider a really bad spread. Overall the MC shows that the VPN can deliver reasonable topline results. One of the main attractions to me initially with this indicator was to hopefully achieve an increase in winners, but the VPN only delivered a very marginal increase (almost nothing) of about 0.5%--no where enough to get me excited. The increase in net profit did seem to come with an increase in system DD (see third chart below) but that really only came about during the March Covid crash. Drawdowns prior to the Covid crash did seem to be slightly less in the system with the VPN.

Would I Use the VPN

While it was interesting to experiment with the VPN I will unlikely go much further with it. One of my primary objectives was to increase the % winners and the VPN doesn't deliver on that. The fact that the system with the VPN delivers less consecutive winners is also a bit of a turnoff for me. Anyway, if you're only chasing an improvement in topline returns then it might be wise for you to explore the VPN.

WITHOUT VPN (LEFT) WITH VPN(RIGHT)

View attachment 127540

MC WITHOUT VPN (LEFT) MC WITH VPN (RIGHT)

View attachment 127541

DD WITHOUT VPN (LEFT) DD WITH VPN (RIGHT)

View attachment 127542

Hey @MovingAverage, thanks for putting this test up. It really gives me some time to think critically about system robustness, sample size, standard error, etc. I have been doing some research on statistical significance of backtest sample size and the effect of standard error on system expectancy and I have a few questions I am hoping we can dicuss regarding charts you attached.

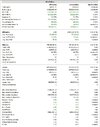
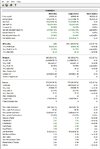
1. I can see your Average Profit/Loss % (expectancy per trade) with the addition of the VPN has increased by 7.84%. I was hoping you might be able to post the Standard Error $ values for both backtests as they have been cut off by the screenshot.

2. I am having a look at the both the Monte Carlo simulations and from them I believe I understand the following:

In 75% of simulations, both systems will see drawdowns greater than or equal to -100% and annual returns less than or equal to -100%. This means that over 21 years, there is a 75% chance that both systems won't even break even. Am I undertanding this correctly? I ask because I have had the same sort of thing happen in my long term backtests and if I am right, that is more than concerning.
 
Last edited:
Hey @MovingAverage, thanks for putting this test up. It really gives me some time to think critically about system robustness, sample size, standard error, etc. I have been doing some research on statistical significance of backtest sample size and the effect of standard error on system expectancy and I have a few questions I am hoping we can dicuss regarding charts you attached.

1. I can see your Average Profit/Loss % (expectancy per trade) with the addition of the VPN has increased by 7.84%. I was hoping you might be able to post the Standard Error $ values for both backtests as they have been cut off by the screenshot.

2. I am having a look at the both the Monte Carlo simulations and from them I believe I understand the following:

In 75% of simulations, both systems will see drawdowns greater than or equal to -100% and annual returns less than or equal to -100%. This means that over 21 years, there is a 75% chance that both systems won't even break even. Am I undertanding this correctly? I ask because I have had the same sort of thing happen in my long term backtests and if I am right, that is more than concerning.
Hi @Cam019,
Complete results below--which is for no VPN and second is with VPN.
Your second question is a very good question and it is the very reason I really dislike the way in which AB does MC testing. I have been meaning to do a post on this for a long time and now that you have prompted me I will do that over the weekend--stay tuned for that. But getting back to your question--your point is not an incorrect conclusion based on AB's MC analysis. Having said that, however, the way AB does MC testing is flawed and is very misleading and the MC results do not really reflect a systems behavior. I've posted on this before, but I wouldn't put any faith in AB's MC results and the best way to get more meaningful MC insight is to add a random element to your buy condition (using mtRandom()) then insert a dummy param into your AFL and optimize that over a 1000 or so (this will depend on your system). Export the optimization results into a CSV and import into Excel. Use Excel's statistic package plug in and then do a distribution analysis of your results for a better MC analysis. I also commonly do a AB scan on my system, which will dump out all possible trades, I then export that into CSV and import into TradeSim, which does a really good statistical and MC analysis of your system.
Using either Excel or TradeSim you will quickly realize AB MC is very poor, but more important the way it does MC is just wrong IMHO and I would never trust it. Hope this helps

WITHOUT VPN

std complete.JPG

WITH VPN


VPN Complete.JPG
 
Last edited:
What’s the point of small trades of as low as 1 unit across a variety of stocks that could be valued from as little as .05c and upward.

I understand some maybe completing orders, however some sit or are initiated as next day opening bids at highest price seen for a stock in eons.

If again clearing orders is the reason why are they not cleared by the previous days end?

Any insights would be appreciated…..
This really gets up my nose--see it all the time during pre-open and it always smells of someone trying to price hunt to push the IAP in one direction or another.
 
The Importance of Monte Carlo Analysis and the Way you Do It.

At @Cam019 recently responded to my VPN post and it spurred me into action about sharing my thoughts on the way Amibroker does Monte Carlo (MC) analysis. I'll explain to you why I believe Amibroker doesn't provide accurate insight into a system's performance using its built in MC analysis. I'm not going to explain what MC analysis is (Google is your friend for that) other than to say in simple terms that it provides a much clearer picture on the range of your system's performance (worse case through to best case) on just about any metric you care to judge your system by. I mean no offence to anyone by saying this, but anyone who moves from developing and testing a system to live trading that system based on single back-testing results without regard to MC analysis is just asking for trouble.

Amibroker and its Built In Monte Carlo Analysis

I am a massive fan of Amibroker and nothing comes closes to its capabilities for rapidly developing, testing, refining and executing trading systems. Personally. I struggle to fault Amibroker....but. Yes there is a but....and for me that is its built in MC analysis--it is terrible and to me it seems very much like a quick and dirty add on. I'd never say that to Thomaz because as those that frequent the Amibroker forum know all too well, hell have no fury like a Thomaz scorned :p

Anyway, what is it I don't like. Well in summary, the way Amibroker does MC is that it simply uses the executed trades (taken) during a single back-test and merely shuffles those around in time. What's the big deal about that I hear you say, well to me understanding the system performance and the extremes of how that system will perform is not provided by simply re-shuffling in time a set of executed trades. I struggle to understand what insight that actually provides in terms of broader system performance.

In my opinion the best way to understand how a system performs is to use an MC approach in which each of the runs executes a different set of trades. There may be some overlaps between the different trade sets, but what is important is that there are different trades in each distinct set. Amibroker's internal MC testing does not approach it this way so how do you achieve that? Well as I mentioned in my response to @Cam019 the best way to get there is through adding a randomness element to your buy conditions. In Amibroker this can be done using the mtRandom() function. Using a dummy parameter and optimizing that over say 1000 runs (this value needs to be considered carefully in the context of how many signals your system generates) you will end up with 1000 different backtests from your system over different trade sets. You can export those optimization results from Amibroker into Excel and do some great statistical (MC) analysis. This in my opinion is the easiest and best way to do MC analysis of your system and will provide far superior insight to your system's performance. The other big advantage of this approach is that you can do MC analysis on just about any system metric you can think of--Amibroker only does MC analysis on the equity curve and to me there are other aspects of a system I'm more interested in doing MC on other than just the equity curve.

MC analysis can be an extremely complex subject and so the above simplifies a lot of important points that you would need to consider. For example, my above comments assume your system generates far more signals than you can take. If you have a system that only generates a few signals and your system takes all of them then my suggested approach is probably not applicable.

Summary

Please tread carefully when looking at Amibroker's inbuild MC analysis. All it does is shuffle around a set of executed trades from a single back-test, which to me doesn't really provide any meaningful insight into a systems broader performance. For better MC analysis and realistic insight consider adding randomness to your buy condition and doing analysis with an external tool such as Excel.
 
hell have no fury like a Thomaz scorned
I describe Tomasz as the Donald Trump of programming...pompous, full of himself, doesn't listen to others (i.e. his end users), an idea is useless unless he thought of it, arrogant, abusive, instantly defensive if someone challenges his ideas, etc.

I too think Amibroker is great, but I could probably cite 20-50 bugs/design bugs.

I'm enjoying comparing RealTest with Amibroker (probably sacrilegious in this thread, but one should always be open to new ideas).

Re: MC, I was told to tick "Simulate using portfolio equity changes", esp. when using compounded position sizing.
Not saying AB is perfect, but hey show me any software that doesn’t have bugs. I’ve not spent any real time looking at RealTest, but have heard mixed heresay, but need to check it out for myself at some stage—nothing wrong about mentioning alternatives here. Equity changes in AB MC testing is just as bad…no matter what mode you use in AB MC it is all bad and I personally don’t place any faith in it.
 
The Importance of Monte Carlo Analysis and the Way you Do It.

At @Cam019 recently responded to my VPN post and it spurred me into action about sharing my thoughts on the way Amibroker does Monte Carlo (MC) analysis. I'll explain to you why I believe Amibroker doesn't provide accurate insight into a system's performance using its built in MC analysis. I'm not going to explain what MC analysis is (Google is your friend for that) other than to say in simple terms that it provides a much clearer picture on the range of your system's performance (worse case through to best case) on just about any metric you care to judge your system by. I mean no offence to anyone by saying this, but anyone who moves from developing and testing a system to live trading that system based on single back-testing results without regard to MC analysis is just asking for trouble.

Amibroker and its Built In Monte Carlo Analysis

I am a massive fan of Amibroker and nothing comes closes to its capabilities for rapidly developing, testing, refining and executing trading systems. Personally. I struggle to fault Amibroker....but. Yes there is a but....and for me that is its built in MC analysis--it is terrible and to me it seems very much like a quick and dirty add on. I'd never say that to Thomaz because as those that frequent the Amibroker forum know all too well, hell have no fury like a Thomaz scorned :p

Anyway, what is it I don't like. Well in summary, the way Amibroker does MC is that it simply uses the executed trades (taken) during a single back-test and merely shuffles those around in time. What's the big deal about that I hear you say, well to me understanding the system performance and the extremes of how that system will perform is not provided by simply re-shuffling in time a set of executed trades. I struggle to understand what insight that actually provides in terms of broader system performance.

In my opinion the best way to understand how a system performs is to use an MC approach in which each of the runs executes a different set of trades. There may be some overlaps between the different trade sets, but what is important is that there are different trades in each distinct set. Amibroker's internal MC testing does not approach it this way so how do you achieve that? Well as I mentioned in my response to @Cam019 the best way to get there is through adding a randomness element to your buy conditions. In Amibroker this can be done using the mtRandom() function. Using a dummy parameter and optimizing that over say 1000 runs (this value needs to be considered carefully in the context of how many signals your system generates) you will end up with 1000 different backtests from your system over different trade sets. You can export those optimization results from Amibroker into Excel and do some great statistical (MC) analysis. This in my opinion is the easiest and best way to do MC analysis of your system and will provide far superior insight to your system's performance. The other big advantage of this approach is that you can do MC analysis on just about any system metric you can think of--Amibroker only does MC analysis on the equity curve and to me there are other aspects of a system I'm more interested in doing MC on other than just the equity curve.

MC analysis can be an extremely complex subject and so the above simplifies a lot of important points that you would need to consider. For example, my above comments assume your system generates far more signals than you can take. If you have a system that only generates a few signals and your system takes all of them then my suggested approach is probably not applicable.

Summary

Please tread carefully when looking at Amibroker's inbuild MC analysis. All it does is shuffle around a set of executed trades from a single back-test, which to me doesn't really provide any meaningful insight into a systems broader performance. For better MC analysis and realistic insight consider adding randomness to your buy condition and doing analysis with an external tool such as Excel.
MA, I think you're doing great things presenting these concerns and a logical alternative to those developing systematic systems. I'd be very interested to know more about how you analyse datasets in Excel. Over the last 6 months I've tried various approaches along these lines to try and really "stress test" key parameters in strategies without over-optimisation. Plotting up key KPIs (e.g. MaxDD, CAR, Profit F, % winners) across these runs seems a valuable technique for assessing robustness as well as looking for broad peaks to base optimized parameters on.

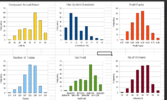
I gather you're looking to produce frequency distributions in Excel among others things, like below. From memory that graphic is from a post by past ASF member "stevo" (apologies if I've got that wrong and was you or anyone else from ASF) - who incidently used to post some marvellous analytical work. Would love to corner him for a day in a quiet spot with beer and a laptop! :)

1627103251956.png
 
MA, I think you're doing great things presenting these concerns and a logical alternative to those developing systematic systems. I'd be very interested to know more about how you analyse datasets in Excel. Over the last 6 months I've tried various approaches along these lines to try and really "stress test" key parameters in strategies without over-optimisation. Plotting up key KPIs (e.g. MaxDD, CAR, Profit F, % winners) across these runs seems a valuable technique for assessing robustness as well as looking for broad peaks to base optimized parameters on.

I gather you're looking to produce frequency distributions in Excel among others things, like below. From memory that graphic is from a post by past ASF member "stevo" (apologies if I've got that wrong and was you or anyone else from ASF) - who incidently used to post some marvellous analytical work. Would love to corner him for a day in a quiet spot with beer and a laptop! :)

View attachment 127810

Hey @Newt, those frequency distribution charts in your post are exactly the type of analysis I'm suggesting for Excel. I've just finished running some AB sims this afternoon for a follow-up post to describe the steps I use in Excel for this type of statistical analysis. I'll be making that post tomorrow so stay tuned for that. Using those distributions the overall objective then becomes one of moving those frequency distributions up, down, narrowing it or widening it depending on your objective. I will say that using AB and Excel for this process can at times be a little tedious and that's why I prefer TradeSim as I find the latter a bit more efficient. Either way, Excel is an amazing tool for doing a more comprehensive analysis of your system and is a great place to start.
 
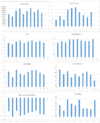
Yes, it might be helpful to have some sort of Excel template for this. In the past I've tended to just past backtest runs into Excel and do formulae to pull it together for something worth graphing. Can't find the spreadsheet where I experimenting with Stevo style output frequency histograms, but here is a fairly primitve set set of bar graphs when I was trying 10 runs with small % randomness built in to Buy while various Buy conditions where turned on or off (or optimized). This is for a single 10 run backtest. You'd need to run around 200 to get something approaching the steve plots in my post above of course.

Looking forward to future posts MA when you have time.

Agree there is value not only in increasing key parameters, but considering spread of possible values in your backtest universe - in real life you always tend to end up closer to the min value than max :)

1627114563604.png
 
I describe Tomasz as the Donald Trump of programming...pompous, full of himself, doesn't listen to others (i.e. his end users), an idea is useless unless he thought of it, arrogant, abusive, instantly defensive if someone challenges his ideas, etc.

I too think Amibroker is great, but I could probably cite 20-50 bugs/design bugs.

I'm enjoying comparing RealTest with Amibroker (probably sacrilegious in this thread, but one should always be open to new ideas).

Re: MC, I was told to tick "Simulate using portfolio equity changes", esp. when using compounded position sizing.
Sadly true, working in IT, i have seen many like him.it is sad to show such arrogance preventing meaningful improvement in the software.which is looking a bit outdated by now and also has some bugs left after more than a decade
 
Top