Australian (ASX) Stock Market Forum

Dump it Here

Slightly off topic - many people who trade systems (and probably discretionary traders too) have had less than spectacular returns in April compared to the earlier months of the year. The XAO is at record highs just about. What indicator (eg sentiment, Adv/Decline, VIX, momentum etc etc) can pinpoint the change in the market? Any thoughts or ideas appreciated

What indicator can pinpoint the change in the market?
@martyjames I've made over 34 separate posts just on the indicators that I use in my trading. The search feature is you friend but as a refresher, most of my strategies uses volatility & momentum indicators to enter & exit positions. There is a multitude of indicators that can help identify the direction, strength, momentum & volatility but there are two indicators (ROC & ATR) to keep it simple. Typically, most strategies gauge momentum & volatility during price consolidation & retracements which could be something new to try.

Trend Indicators
A few simple trend indicators are all you need to see when to enter a position. Entries during trends require almost no brain cells. (ATR) is a volatility indicator, combined with a momentum indicator (ROC) tells a powerful story. A Commodity Channel Index (CCI) is a momentum-based oscillator used to determine overbought or oversold conditions but this indicator is best used in conjunction with additional indicators. The Rate-of-Change (ROC) is another handy indicator & I use the ROC indicator in every strategy that I code to confirm the increasing momentum of a trend.

What drives a trend?
"Volatility & Volume" are the real driver of a trend - meaning we enter a trend on volatility & volume - getting off when the trend turns. It pays to do your own research to find indicators that will work for you. Getting into a trend is not that difficult using an indicator, using two is sometimes better. Getting out of a trend & timing the exit is a little more complex.

More here

Skate.
 
Hi Skate

Slightly off topic - many people who trade systems (and probably discretionary traders too) have had less than spectacular returns in April compared to the earlier months of the year. The XAO is at record highs just about. What indicator (eg sentiment, Adv/Decline, VIX, momentum etc etc) can pinpoint the change in the market? Any thoughts or ideas appreciated

Cheers
Marty
We discussed april performance a bit in the last weeks, i believe both Skate and I had a pretty good month, even if erratic.
For me: much better than the first 3 months of this year which saw me loosing around 2/3 of the FY gains.now stabilised and recovered a bit..for the syatems..but have not checked today yet?
 
Ok a lot of red today here too but kind of ok and getting more and more into cash as my guppy system has been selling and not buying for quite a few days.both volatility into full cash and only daily qfduc nearly fully invested. In my systems i trust?
 
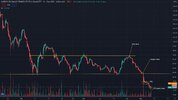
View attachment 123845
Today
If you can't say anything nice, say nothing at all.

View attachment 123846

Skate.


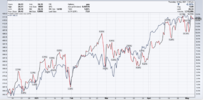
The following chart illustrates the ASX/SPY:

Screen Shot 2021-05-07 at 6.49.36 AM.png

Currently you chaps are tracking the US pretty tightly. If your stops/exits do not trigger today, I think next week you recover. While the US is very choppy, most of the sectors are holding the line, with the exception of Tech. There is a narrative however (rumour) that Wall St. is attacking Cathy Wood and ARK. There could be a short squeeze hiding in there. If Tech. can generate a squeeze and the w/e is the perfect opportunity, SPY moves higher in a hurry, which, relieves the pressure on the ASX.

jog on
duc
 
Is this now a loss pr0n thread?

DD.jpg

Do I rebuy after the trend break?

Did I?

F**K.


Probably going to top up some more tonight like the total degenerate that I am.
 
I was having a joke to try & make you feel a bit better...
 
I got absolutely ass-f***ed so far.
I was having a joke to try & make you feel a bit better...

Ok, now I see the reference
Looking at your chart & buy points @PinguPingu nailed your predicament on this trade.

"Bloody Thursday"
Thursday was the undoing of my trading this week & looking at your recent trading decisions - didn't make me feel any better at all.

Probably going to top up some more tonight like the total degenerate that I am.

Shouldn’t we seek out “bargains” when we buy a stock?
Unfortunately, whether or not a stock actually is a bargain has little to do with how the current price relates to past prices. In fact, the best bargain may actually be a stock that is trading at its highest price & the "worst bargain" may be the one trading at its lowest price.

Skate.
 
Thanks @Skate

If you are able to come up with something that impressive and you are "time poor"

I'd love to see what happens when you are "time affluent" :nailbiting: :)

I have no idea how you code what you do, but I am suitably impressed with how you do it none the less!?

I have no doubt you will find other ways to play around with and tweak the VWAP and maybe incorporate it into other strategies?

If it ends up being useful (hopefully valuable), that would be fantastic!

Cheers:cool:

haven't come in here in a while but just reading through these notes on vwap and backtesting.

Skate has developed a system using Nick Radge comments on his daytrading system and getting good results.
Barney added - hey use Vwap as an indicator.

Vwap or volume weighted average price is mostly used by intraday traders, typically the 1day vwap or the average price. Some traders will use a 2day vwap as well

Nick system is daily right?, it uses daily prices not intrad-day,

I've never come across anyone using Vwap on the daily systems as an indicator.
 
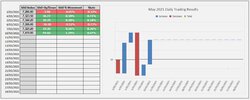
View attachment 123894

I'm wishing for better luck next week
No matter which chart I use, this was a down week.

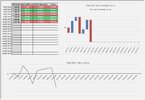
View attachment 123895


View attachment 123896


Skate.


So the 'UP' day on Friday indicates that you have weathered the storm, a torn sail or two, but enough to still make headway. The US is having a good day today:

Screen Shot 2021-05-08 at 7.15.36 AM.png

I would therefore anticipate calmer waters come Monday and the portfolio to jump higher. Volatility in individual names is mostly higher than an index or sector ETF. The wild swings, while not conducive to stress free living are nonetheless the game that we play.

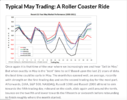
So I have noticed a significant drop-off in the 'Sell in May' meme. I think the Bears have now missed their opportunity to pour on and push prices lower. Tech. as a sector, was where they had some success, now however with yields falling again, Tech. I suspect will rally. That strength coming back in will obviously boost indices and stocks as a whole, take a cue from indices.

Here however is some further data (that actually sort of corresponds with my gut):

Screen Shot 2021-05-08 at 7.34.33 AM.png


This one I think you will appreciate:

Screen Shot 2021-05-08 at 7.29.16 AM.png


jog on
duc
 
So the 'UP' day on Friday indicates that you have weathered the storm, a torn sail or two, but enough to still make headway. The US is having a good day today:

View attachment 123922

I would therefore anticipate calmer waters come Monday and the portfolio to jump higher. Volatility in individual names is mostly higher than an index or sector ETF. The wild swings, while not conducive to stress free living are nonetheless the game that we play.

So I have noticed a significant drop-off in the 'Sell in May' meme. I think the Bears have now missed their opportunity to pour on and push prices lower. Tech. as a sector, was where they had some success, now however with yields falling again, Tech. I suspect will rally. That strength coming back in will obviously boost indices and stocks as a whole, take a cue from indices.

Here however is some further data (that actually sort of corresponds with my gut):

View attachment 123924


This one I think you will appreciate:

View attachment 123923


jog on
duc
Love that quote, and true for more than the financial market
 
Let's talk about the brilliance of John Ehlers
I should say from the get-go, I a big fan of John Ehlers & his work on low lag indicators. In the context of technical analysis, we are all looking for an indicator that could give us an edge (a slight advantage) when trading & it's usually achieved by our use of indicators or a combination of indicators.

How to predict the future
Using any indicator can't really predict the future but they can give us clues or signs or a small piece of information that something is happening slightly in advance to other indicators. Using any of John Ehlers indicators can be somewhat complicated because of the mathematical calculation based on price, volume, or a combination of both.

A Peek into the Future
John Ehlers describes the calculation of the “A Peek into the Future” filter could help signal cyclical turning points in the markets. Disclaimer: John Ehlers filters can't actually see into the future, but it may provide signals in advance of other indicators. The "Voss Predictor" is an interesting predictive tool that can identify early turning points of the market. Ehlers suggests that simple crossovers of the forward-looking Voss predictor may become the basis of a trading system but goes on to say that it needs to be used with "an additional trend detector"

If interested
More information on the “A Peek into the Future” filter can be found here: https://www.mesasoftware.com/papers/A PEEK INTO THE FUTURE.pdf

If you are really interested in his work
His papers can be found here: https://www.mesasoftware.com/papers/

Skate.
 
Yep, today was a bloodbath. Skate.

I mentioned on the VML Thread that I thought the Market was potentially "nasty" at the moment @Skate

If chaps like yourself (with excellent coded systems) are suggesting similar

Then I feel I am likely close to the pulse, even though I am 110% discretionary in my approach, LOL:wheniwasaboy:


Being correct, or close to the pulse however gives little solace when the Trading A/C is being "tested" :blackeye: :nailbiting:

It's been a difficult period recently, no question.


No "advice" is warranted/required from me, but, if I were asked to offer some,


I would suggest that Punters ... (at this point in time/currently)


Pick their (BUY) Stocks on their short term merit, and,

Cull (SELL) the under-performers .... until things stabilize!


I'm sure that's a BIG HELP (Not) to everyone bleeding cash at the moment:unsure:


Basically, the above advice in a nut shell would be ....


Play the Long Game


i.e. Protect your capital to the best of your abilities, so you can come back throwing punches when things have "improved"
 
Ehlers suggests that simple crossovers of the forward-looking Voss predictor may become the basis of a trading system but goes on to say that it needs to be used with "an additional trend detector"

The Voss Strategy
I've just finished coding the "Voss Strategy" & after running a series of backtests it appears to capture an early trend nicely. The buy would have been much earlier if my parameter & filters weren't so harsh.

The hard work to make the strategy perform (undisclosed)
1. StaleStopPeriod (undisclosed)
2. Filters (undisclosed)

For the technical minded (Amibroker)
Below is a "heads-up" with a few of the arrays that drives the "Voss Strategy" for those who want to have a play. The arrays are self-explanatory. It's vital that the market is bullish & I've used a SMA to handle that aspect. The ROC Filter needs to be positive as well - which means no signal can be taken when the Ribbon displays a yellow bar.

It's important to note
1. The markets need to be bullish (Also, an INDEX Filter is required)
2. The ROC Filter needs to be positive.
3. A Buy is when the Close of the Voss Indicator (BLUE line) is above ZERO & all Weekly Filter parameters & conditions are met.
4. I've used the standard parameters as indicated by John Ehlers (period 20, predict 3)

StaleROCPositive = ROC( Close, staleStopPeriod ) >= 0; //StaleStopPeriod (undisclosed)
Bullish = C > MA( C, 50 );
Voss = Voss AND Bullish AND Filters; //Filters (undisclosed)
BuySetUp = (C > Voss AND INDFilter) AND StaleROCPositive;

Recent Backtests
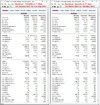
I've completed two recent backtests to display that the "Voss Strategy" is worthy of future development as the initial results aren't too shabby at all.

Backtest periods

(a) 1st January 2021 to "end of close today"
(b) 1st March 2021 to "end of close today"

Voss Combined Capture.jpg


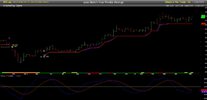
#1. Charts
(ASX:NEC) Displays that the position is still in play. The lower part of the chart displays the Voss Indicator (BLUE Line) that precedes the Filter (RED Line). The yellow line is the "ZERO" line. No position can be executed when there is a yellow ribbon displayed.

Voss Chart Capture.JPG


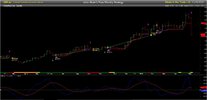
#2. Charts
(ASX:ABR) Displays that the position (ABR) is still in play "BUT" it's marked as a sell today (actionable on Monday). The lower part of the chart displays the Voss Indicator (BLUE Line) that precedes the Filter (RED Line). The yellow line is the "ZERO" line.

Voss Chart Capture2.JPG


The Voss Strategy
Using the Voss indicator & bullish indicators makes for a simple trading strategy, ideal for those just starting out.

Skate.
 
#1 Pick their (BUY) Stocks on their short term merit, and, Cull (SELL) the under-performers .... until things stabilize!
#2. Play the Long Game

@barney, as usual your posts are spot on.

I'm suggesting
For those who are new to trading or feeling nervous in the markets at the moment heed Barney's #1 advice - for all others go for option #2.

Tomorrow
Is another day.

Skate.
 
Top