Australian (ASX) Stock Market Forum

Dump it Here

Trading a combination of strategies
The most important thing is to keep trying various methods until you arrive at an approach that works as @ducati916 recently posted. Trading is all about trial & error. Unfortunately, the market often makes that quite difficult, because it is always changing, so the things that work best during one period may change. However, that doesn’t mean that you reinvent yourself every time you struggle a bit. After you develop a style, it is important to stick with it and not give up just because you don’t make immediate progress.

We are all different
We all have different levels of risk tolerance, patience, activity, & different approaches in handling the emotional ups & downs of the markets. What is comfortable for one will drive another to distraction & if you can appreciate that fact, arriving at a style that works for you is easier.

The equity curve displays that it's rising over time
The angle of the "overall rise" should paint a powerful picture for others.


View attachment 123221

Skate.
Bar of profit? Do tou mean from 3 to 5 systems?
 
Bar of profit? Do you mean from 3 to 5 systems?

@qldfrog, the number of strategies I trade at any one time varies to a degree.

One $700k strategy
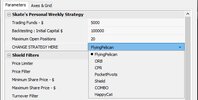
In my personal trading (excluding my SMSF) $700k allows me to trade 7 different strategies at one time. Trading this way is effective & simple. It would be simpler if all the strategies had the same settings, parameters, filters & positionScore but that's not the case.

Smoothing returns
Reading your "thread" each week you reflect on the returns from each of your strategies, some are up, some are down, but you always finish with a combined tally. The combined tally is the measure of your trading. With me, it's no different.


Combo Capture.JPG


Skate.
 
What I do know about trading
1. Trend Following works
2. $15k moves in & out of the markets with ease
3. Timing the exit - makes the money
4. Having a sound trading plan & sticking with it - pays
5. You can't eat percentages
6. Anytime your ROI is greater than 6% - indicates you are doing well
7. Daily/Weekly/Monthly "fluctuations" are part of the trading game
8. Simplicity works (overtime)
9. The bulk of new traders lack discipline, commitment & confidence
10. It requires money - to make money

Skate.
 
April is 100% up. Yes 100% up. It is living to expectation so far. May however is a different story, not terrible, but less than April. June/July both 100%. Exit for the 3 worst months: Aug/Sept/Oct. Re-enter Nov/Dec.

I'd be interested to see a systems chap test it. It is supposed not to work.

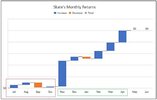
2020/2021 Monthly results
1. July 2020 to the end of October 2020 cancelled themself out.
2. @ducati916 idea to enter in Nov/Dec "worked" for my Monthly Waterfall Chart of returns.
3. February 2021 to April 2021 - smooth consistent returns.


Monthly returns Capture.JPG


The market gives what they want to give
Those two down months (September 2020 & January 2021) really hurt.

Market "fluctuations"
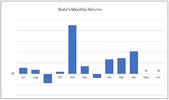
#7. Daily/Weekly/Monthly "fluctuations" are part of the trading game


Bar Capture.JPG

Skate.
 
What I do know about trading
#1. Trend Following works

With the computer age
I’m thinking times have changed.

Excerpt from: The Intelligent Investor, Benjamin Graham
In our own stock-market experience and observation, extending over 50 years, we have not known a single person who has consistently or lastingly made money by thus “following the market.” We do not hesitate to declare that this approach is as fallacious as it is popular.

Skate.
 
Last edited:
1. What I do know about trading
#1. Trend Following works

2. With the computer age
I’m thinking times have changed.

3. Excerpt from: The Intelligent Investor, Benjamin Graham
In our own stock-market experience and observation, extending over 50 years, we have not known a single person who has consistently or lastingly made money by thus “following the market.” We do not hesitate to declare that this approach is as fallacious as it is popular.

Skate.


1. Yes it does. However, stocks, etc. can trend in all directions, up, down, sideways. The key (obviously) is to be in the trend that you have identified as making a profit for your style. The thing with trends is that they have (a) start, (b) middle and (c) end. They are not linear. Unless you jump in at (a) there will be higher volatility around the position (b) which has to be differentiated from (c). This of course, is what all the variations of your systems trade on.


2. Times never change because people never change. Market prices fluctuate only because of people acting. The difference (in the short term) is the massive intervention of the Fed. Different Fed. Chairs have had quite different approaches to how the Fed. has intervened within financial markets. Volcker in the 1970 - 1984 markets, was a very different proposition to Greenspan et al. who followed. Obviously, in 1929, the Fed. did nothing overmuch (Chair Young then Meyer). In 1942 - 1950, (Eccles and McCabe) the Fed became as a result of the 1930's market, quite proactive during and after the war years and massive government debt, which is the current playbook. That era led into the highly inflationary period that eventually blew-up in the 1969-1982 markets. The difference, was the starting valuation of the market as compared to today.

3. My interpretation of this excerpt is that selection, entry and management have to be systemised, rather than following the market, which are the stocks displaying the highest price appreciation currently. Now Graham selected stocks in a number of different ways, the net-net method being available in the 1930 - 1949 period, but probably never since. He was also one of the early activist investors, loading the seats on Boards, arbitrage, long/short strategies using Convertibles, PIPEs, outright ownership, etc. This chap literally wrote the book on how to play the market. Buffett sat on his knee and learned from the master.

So the argument is for a principled, systematic and rational approach to selection, rather than simply some ad hoc approach based on narrative, popularity and particularly marketing from Wall St.. viz: SPACS etc.

A mechanical system, with entry/exit rules is a principled methodology. Here is the thing: so many market participants are just plain lazy. They do not want to do the necessary work. Whether that is building a systematic mechanical system, micro/macro analysis, theories around risk management, etc, etc, etc. They think it is easy money. Plonk it down on Dodgy Coin and become a millionaire almost overnight. That is the example Graham refers to: following the market. Many were millionaires from crypto last week. A lot fewer today. Possibly even fewer next week. Making it is one thing. Hanging onto to it is quite another thing.


jog on
duc
 
41%-win rate is highly frustrating
Let me state the obvious, "trend trading systems have more losers than winners". The few positions that do win are the reason why this style of trading is successful & profitable. At times waiting for a trend trading strategy to develop into profits can be a hard ask - a step too far (for some).

1. So, why do trend followers have a low win rate?
I wish I had a definitive answer but I'm yet to find the main reason that is constantly causing me grief. It's really annoying at times when you enter a new position only to experience a quick pullback, which at times makes me want to take the "Lord's name in vain".

2. Pullbacks at times are hard to handle
Pullbacks could be one reason for a low win percentage of a trend trading strategy or it could be the "main reason", I just don't know. What I do know is @peter2 has capitalised on these pullbacks more than once. A pullback can happen right after a breakout or later in the trend, but these pullbacks cause all trend traders a lot of grief. Reducing pullbacks with this style of trading is not an easy issue to overcome.

More to follow.

Skate.


I was waiting to see how this developed and whether the 'edge' garnered further discussion/analysis. As it didn't really seem to garner overmuch attention, I thought on a Sunday afternoon, it merited a little further discussion.

2. First we need to define a trend. It is either a 'Win' one step up or a 'Loss' one step down. A trend would look something like, 'W,W,W,W,L,W,W,W.....and over time the series would move higher.

All manner of financial instruments have in the past demonstrated trends, either higher or lower. We have to somehow account for the 'W' outcome prevailing. The market, or stock, is exposed to 'Events' and 'Interpretation' of those 'E' by 'Traders'. If enough 'T', 'I' the 'E' in the same manner, then we see a consensus of either 'W' or 'L' developing into a trend.

Mechanical Systems traders have (it seems) tried to define 'what' defines an entry into a trend and an exit from a trend, as simply as possible. To define it exactly, is to overfit the data and invite disaster.

Now it seems, from following this thread, that reams of historical data are utilised and coded into a statistical analysis/testing package, which spits out its statistical analysis.

Somewhere in this thread, someone used the term: 'statistically significant'. That term, refers to a Gaussian distribution of observation errors. First error: Gaussian distributions are within the domain of 'Pure Mathematics', not 'Applied Mathematics'.

The issue with Gaussian mathematics being used in the financial markets is that variations face an exponential drop in the calculated probabilities. Clearly, this causes the problem: stuff happens in the markets every couple of years that should only happen once in the lifetime of the Universe or less, according to the statistics.

So unfortunately, systems traders have no edge other than a disciplined entry/exit. All the numbers generated are fantasy, if they are generated statistically, which I believe that they are. Hence, the low win rate.

3. Pullbacks.

Again a definition would be required. So using our initial definition of a trend, a pullback would be a series of 'L' outcomes that overwhelmed the 'W' outcome, resulting in the series moving lower.

Here we then have to somehow account for trader psychology in addition to the random nature of 'E' by 'T', requiring (again) a consensus of 'I' to re-establish the trend or continue the new trend 'L'.

Now of course 'E' (the future) is random. However the 'I' is in part driven by narrative/spin, in part by inherent biases held by 'T', etc.


jog on
duc
 
Mechanical Systems traders have (it seems) tried to define 'what' defines an entry into a trend and an exit from a trend, as simply as possible.

Landing a drone & flying it on Mars makes trading look simple
With any trading system, you are buying in the hope of selling the position to someone else at a higher price than we brought it.

The basic
Most traders just want to know 3 things. What to buy, when to buy & when to sell. If it was that simple, we all would be handsomely rewarded, but that's just not the case. The uncertainty of what someone will do next is the issue, market manipulation is the other. Once those questions are answered it gives us the privilege to ask the next series of questions.

The main questions that require answering
1. How do we decide what to buy?
2. How do we decide when to buy?
3. More importantly - How do we know when to sell?

AFAIC
The answers to these questions are embodied in this thread.

Skate.
 
Landing a drone & flying it on Mars makes trading look simple
With any trading system, you are buying in the hope of selling the position to someone else at a higher price than we brought it.

The basic
Most traders just want to know 3 things. What to buy, when to buy & when to sell. If it was that simple, we all would be handsomely rewarded, but that's just not the case. The uncertainty of what someone will do next is the issue, market manipulation is the other. Once those questions are answered it gives us the privilege to ask the next series of questions.

1. The main questions that require answering
1. How do we decide what to buy?
2. How do we decide when to buy?
3. More importantly - How do we know when to sell?

AFAIC
The answers to these questions are embodied in this thread.

Skate.


1. (1) Clearly from Dodgy Coin on down, you can pretty much buy anything. (2) and (3):

Screen Shot 2021-04-25 at 4.28.36 PM.png

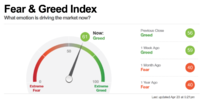
Buy (extreme) fear.
Sell (extreme) greed.

Screen Shot 2021-04-25 at 4.33.33 PM.png

I'm going to road-test this. I'll track it (hypothetically) on my thread.

jog on
duc
 
1. (1) Clearly from Dodgy Coin on down, you can pretty much buy anything. (2) and (3):

View attachment 123309

Buy (extreme) fear.
Sell (extreme) greed.

View attachment 123310

I'm going to road-test this. I'll track it (hypothetically) on my thread.

jog on
duc
What is then the fear greed index?
Volatility aka VIX? I initially thought so but does not seem to match ..anymore?
 
What is then the fear greed index?
Volatility aka VIX? I initially thought so but does not seem to match ..anymore?

How the fear & greed index is calculated
Investors are driven by two emotions: fear and greed. Too much fear can sink stocks well below where they should be. When investors get greedy, they can bid up stock prices way too far.

So what emotion is driving the market now?
CNNMoney's Fear & Greed index makes it clear. "7 indicators" are used to determine the Fear & Greed Index
1. Stock Price Momentum: The S&P 500 (SPX) versus its 125-day moving average
2. Stock Price Strength: The number of stocks hitting 52-week highs and lows on the New York Stock Exchange
3. Stock Price Breadth: The volume of shares trading in stocks on the rise versus those declining.
4. Junk Bond Demand: The spread between yields on investment-grade bonds and junk bonds
5. Market Volatility: The VIX (VIX), which measures volatility
6. Safe Haven Demand: The difference in returns for stocks versus Treasuries
7. Put and Call Options: The put/call ratio, which compares the trading volume of bullish call options relative to the trading volume of bearish put options

Calculations
For each indicator, we look at how far they've veered from their average relative to how far they normally veer. We look at each on a scale from 0 - 100. The higher the reading, the greedier investors are being, and 50 is neutral. Then we put all the indicators together - equally weighted - for a final index reading. When the S&P 500 (SPX) plummeted to a three-year low on Sept. 17, 2008 - the height of the financial crisis -- the Fear and Greed index sank to 12. The index gained some ground to 28 before stocks finally bottomed out on March 9, 2009 and the latest bull market began. Most recently, in the first quarter of 2012, stocks staged their best run-in decades, and the index showed pure greed.

More information found here: https://money.cnn.com/data/fear-and-greed/?iid=EL

Skate.
 
Last edited:
Landing a drone & flying it on Mars makes trading look simple

Focus
I’ve just realised why @peter2 is such a good trader. The secret to his success is his “focus”.

Peter knows when to hold them & know when to fold them
Peter simply knows when to buy them & knows when to sell them. Unfortunately, this takes “acquired experience”.

Acquired Experience
Most would realise it takes a long time to accumulate “acquired experience”, a luxury not afforded to those starting out on their trading journey.

So, what's our next best option?
I'll explain "one option" in the next post.

Skate.
 
One option is to short cut the process
Trend following helps to shortcut the process because from the beginning the three most important questions (issues) can be answered by trading a “trend following strategy”.

1. Deciding what to buy.
2. Deciding when to buy.
3. Deciding when to sell.

Trend Trading
Trading this way creates their own unique set of "problems".

"Problems" is not the correct terminology to use
Using the word "problems" gets the message across but it implies - "there are problems to solve". With trend trading, there aren’t any problems to solve but rather a need for "acceptance" of the "nuances" that this style of trading brings.

Skate.
 
Patchy results
Also, trend trading is "patchy" as it's more likely there will be more losers than winners (I, for one, have accepted this fact). Once you accept this nuance, you'll be required to let the winners run & be ruthless with the losers. (There are no “take profit stops” whilst trend trading)

I don’t like losing money any more than the next guy
It’s hard for anyone to "sit & watch" a position go against you "trend trading" waiting for an exit signal but, "holding firm" is the right thing to do & it works for me. Sitting tight helps to keep you in many of the moves that can result in far greater profit than anyone could have imagined.

Skate.
 
Sticking with your trading plan
I think trend following helps with the process because after a while it becomes clear that loser become less relevant "as" there are so many more losers compared to the percentage of winners.

Two things
1. First, expect to have losing trades & get used to them.
2. Second, recognise when the winners are no longer trending & G.T.F.O.

Losers should be irrelevant
If you can train your mind to accept that sometimes "things just happen" - you'll care less about "how or why" they happened.

Focus
With a "focus" of accepting that sometimes "things just happen" allows you to follow your trading plan & process.

Skate.
 
One option is to short cut the process
Trend following helps to shortcut the process because from the beginning the three most important questions (issues) can be answered by trading a “trend following strategy”.

1. Deciding what to buy.
2. Deciding when to buy.
3. Deciding when to sell.

Trend Trading
Trading this way creates their own unique set of "problems".

"Problems" is not the correct terminology to use
Using the word "problems" gets the message across but it implies - "there are problems to solve". With trend trading, there aren’t any problems to solve but rather a need for "acceptance" of the "nuances" that this style of trading brings.

Skate.


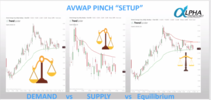
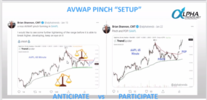
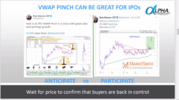
So when to buy. This is the VWAP squeeze or pinch. A good way to determine the trend, as of course you can have shorter term trends within longer term trends.

Screen Shot 2021-04-26 at 3.14.22 PM.pngScreen Shot 2021-04-26 at 3.16.39 PM.pngScreen Shot 2021-04-26 at 3.20.59 PM.pngScreen Shot 2021-04-26 at 3.21.23 PM.pngScreen Shot 2021-04-26 at 3.22.27 PM.png

jog on
duc
 
So when to buy.
This is the VWAP squeeze or pinch. A good way to determine the trend, as of course you can have shorter term trends within longer term trends.

I'm confused
@ducati916, I would be interested in how to trade the "VWAP Squeeze or Pinch". Usually, a picture paints a thousand words but, in my case, it explained "very little".

With further explanation
I may be able to code & backtest the "VWAP Squeeze or Pinch" idea if you explain this method in plain English.

From the "Equilibrium chart" above
1. Is the entry above the upper band & a sell below the lower band?
2. Is the upper red band the (AVWAP) & the lower band the (VWAP)?
3. Are the two bands a short period (AVWAP) versus a longer period (AVWAP)?
4. What is the standard anchor (AVWAP) for a weekly strategy?
5. What calculations are used to calculate the upper band of the squeeze?
6. What calculations are used to calculate the lower band of the squeeze?
7. How is the "VWAP" pinch calculated?

VWAP, VWAP/SMA & AVWAP
I've made 15 posts on how I take advantage of the (VWAP), also how to trade the (VWAP in conjunction with an SMA). I also explain how to anchor the (VWAP) to a defined period (AVWAP). The Anchored VWAP is a modified version of VWAP. It ties the calculations to a specific price bar decided by the trader. It is similar to the traditional VWAP, as it incorporates price & trading volume in a weighted average.

Anchoring ties the calculations to a specific price bar
It's similar to the traditional VWAP, as it incorporates price & trading volume in a weighted average. In other words, the anchored VWAP allows traders to apply the calculation method to any starting point. A defined period of time calculates the "Anchored Volume Weighted Average Price" (AVWAP). Anchoring is what traders do without even thinking. Meaning, we “anchored” our calculations from the price we paid to calculate the risk of the trade.

More information

Skate.
 
From the "Equilibrium chart" above
1. Is the entry above the upper band & a sell below the lower band?
2. Is the upper red band the (AVWAP) & the lower band the (VWAP)?
3. Are the two bands a short period (AVWAP) versus a longer period (AVWAP)?
4. What is the standard anchor (AVWAP) for a weekly strategy?
5. What calculations are used to calculate the upper band of the squeeze?
6. What calculations are used to calculate the lower band of the squeeze?
7. How is the "VWAP" pinch calculated?

VWAP, VWAP/SMA & AVWAP
I've made 15 posts on how I take advantage of the (VWAP), also how to trade the (VWAP in conjunction with an SMA). I also explain how to anchor the (VWAP) to a defined period (AVWAP). The Anchored VWAP is a modified version of VWAP. It ties the calculations to a specific price bar decided by the trader. It is similar to the traditional VWAP, as it incorporates price & trading volume in a weighted average.

Anchoring ties the calculations to a specific price bar
It's similar to the traditional VWAP, as it incorporates price & trading volume in a weighted average. In other words, the anchored VWAP allows traders to apply the calculation method to any starting point. A defined period of time calculates the "Anchored Volume Weighted Average Price" (AVWAP). Anchoring is what traders do without even thinking. Meaning, we “anchored” our calculations from the price we paid to calculate the risk of the trade.


Skate.


1. Yes.
2. Yes.
3. Yes.
4. The lowest bar at the start of an uptrend.
5. As you have already stated.
6. Same as [5].
7. The pinch is simply where the 2 bands, in 2 different time frames, create a Bollinger Band type of effect on the chart.

The advantage (fundamentally) of the VWAP is that many Mutual Funds/Pension Funds, when making purchases or sales of large blocks of stock, want (insist upon) being executed at the VWAP price. The Specialists responsible for working these huge orders, obviously use all manner of tricks to bring price back into range to execute these orders.

You could argue that your bog standard EMA/whatever, will reasonably closely track the VWAP anyway. If you plot them together, they are pretty similar.

However, the 'Pinch" by anchoring on selected Bars, is slightly different. I think you could use it as an entry trigger and something different as an exit trigger. It is used as displayed above as a Swing Trading strategy, with a holding period of about 3 weeks.


jog on
duc
 
The importance of money
“When I was young, I used to think that money was the most important thing in life, now that I’m old I know it is.”

The markets are constantly doing things you don’t expect
Most traders have a habit of overcomplicating their trading & spend an enormous amount of time trying to work out why the price moved.
There will be times when you will think (WTF), but that's ok. As trend traders, we don't need to know why a position is "trending" - but "we need to be on it".

Trading makes me religious
From my experience, those who trade big, pray a lot, they also wish & hope for better times ahead. It's important to develop a strategy that you know works & one that you’ll follow under any circumstance. When you have such a strategy you may never need to pray, wish or hope again. Don't forget when you lose money, 'suck-it-up' & "don't panic". Confidence in this game is essential.

Skate.
 
(BOE) stands for "built on enthusiasm"
Enthusiasm drives the market up & the lack of enthusiasm can drive it in the other direction. Bitcoin is the perfect example of "enthusiasm" as bitcoin is entirely built around that principle. This post is not about bitcoin but how enthusiasm influences the markets.

Bitcoin is built on the enthusiasm of others
Bitcoin has no intrinsic value but the adoption & investment in bitcoin shows no signs of letting up anytime soon. Bitcoin is currently in unchartered territory & nobody knows where the current bull run is going to stop or take a pause. Institutional interest has skyrocketed this year, even Elon Musk is taking a keen interest. The European Union has recently stepped in to capture & regulate all crypto assets to provide legal certainty but flexible enough to allow for future developments. Most major countries have similar plans "so it appears" crypto's are here to stay - in one form or another.

"Sell in May" has gained cult status as a strategy
The "Sell in May" strategy simply avoids holding positions during the month of May. Now that the "ground rules" of enthusiasm have been established let's focus on the "Sell in May & go away" theory.

So we move into May. We know April followed the pattern. I have seen so many blogoland posts re. 'Sell in May'. Possibly I'm looking for it (confirmation bias) or it just seems that it is a real thing atm.

More to follow.

Skate.
 
Top