Australian (ASX) Stock Market Forum

DrBourse General Help for Beginners

After seeing mostly red on my watchlist today, that wonderfully wise sage, the blke in the mirror, he's been absent of recent times, thought WC8 might be worth a squizz and suggested a buy in at 0.705 Finished the day at 0.72 so his crystal ball gazing was good.
Getting used to the new specks Typo should be bloke
 
13/3/24 ....
Something else for the Beginners & Newbies to watch out for…...
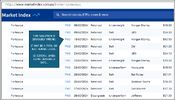
The following snapshot is from a site I often refer to - Broker Consensus & Recommendations (ASX) - Market Index .....
This particular snapshot is from the Broker Consensus page of Market Index…..
It shows a list of recent Broker Valuations – I find the various lists quite informative most of the time – However you need to watch out for the “obviously stupid errors”…
Note that the FMG SP is approx $24.40 atm.....
Note the “three Morgan Stanley Valuations”, 8/2/24, 15/2/24 & 23/2/24….
FMG 20240313 MARKET INDEX BROKER CONSENSUS.png
PS:- I have the FMG IV @ $27.56....

Cheers...
DrB.
 
Last edited:
13/3/24 ....
Something else for the Beginners & Newbies to watch out for…...
The following snapshot is from a site I often refer to - Broker Consensus & Recommendations (ASX) - Market Index .....
This particular snapshot is from the Broker Consensus page of Market Index…..
It shows a list of recent Broker Valuations – I find the various lists quite informative most of the time – However you need to watch out for the “obviously stupid errors”…
Note that the FMG SP is approx $24.40 atm.....
Note the “three Morgan Stanley Valuations”, 8/2/24, 15/2/24 & 23/2/24….
View attachment 172664
PS:- I have the FMG IV @ $27.56....

Cheers...
DrB.
As usual Dr B on the "money".
Figure 6 is not exactly next to figure 2 on the keyboard.
 
The month of May is here again - I feel it is time to repost this one again.

"Everybody needs to get up to date with “OLD SAYINGS” – They are just that – “USELESS OLD SAYINGS”……The fear everyone has about May & October each year is RIDICULOUS - most are Great Months – Particularly since the year 2000…..

OCTOBER for 2000, 2001, 2002, 2003, 2004, 2006, 2007, 2010, 2011, 2012, 2013, 2014, 2015, 2017, 2019, 2020, 2021 & 2022 were all UP....

OCTOBER for 2005, 2008, 2009, 2016 ,2018 & 2023 were all DOWN.....

MAY for 2001, 2002, 2003, 2004, 2005, 2007, 2008, 2009, 2014, 2016, 2018, 2019, 2020 & 2021 were all UP.....

MAY for 2000, 2006, 2010, 2011, 2012, 2013, 2015, 2017, 2022 & 2023 were all DOWN.....

Now I need to clarify something about the May/October Theory, it all depends on which school you went to....

Some say that the calculation is "that a particular month is either Up or Down in relation to the previous month" (not really sure what part of the previous months data they would use - High, Low, 1st day, Last day, etc)...

Most Analysts/Brokers say the calculation is "that a particular month is either Up or Down from Close Of Trading on the 1st day of the month to Close Of Trading on the last day of the month...

Others suggest the calculation should be from "the opening price on day one to the closing price on the last day of the month...

The May/Oct Theory dates back to the early to mid 1900's when Company Reporting Rules revolved around the now obsolete March & September Reporting Timetables.....

They are old "Share Trading Rules" that belong to a past era, and as such have outlived their usefulness - Smart Brokers are using scare tactics and misguided fear to make profits at your expense.. WAKE UP AUZZIE..... Savvy Brokers are all about setting you up AGAIN......

When you think about it, it really is a form of Ramping......

All I can suggest is that you must DYOR if you are relying on this OUTDATED THEORY...."

Cheers...
DrB.


i think the 'sell in May ' mantra is about selling in a ( normally ) rising market to pay tax-bills ( or crystallizing tax-losses )

AND 'sell in May ' is mostly aimed at the Northern Hemisphere ( because the rest of the mantra is .. ' come back St Leger Day' a classic racehorse event run in many Western nations )

now if you sold in May and went on a long Summer vacation , and started buying in September ( infamous for the odd big dip ) and hoping for a Xmas rally ....

now me being a contrarian , i am often 'cherry-picking ' stocks when ( theoretically ) the 'smart money ' is on the side-lines

now if i have a decent stock sitting in a decent profit i am very reluctant to sell it ( completely ) without a good reason
 
The month of May is here again - I feel it is time to repost this one again.

"Everybody needs to get up to date with “OLD SAYINGS” – They are just that – “USELESS OLD SAYINGS”……The fear everyone has about May & October each year is RIDICULOUS - most are Great Months – Particularly since the year 2000…..

OCTOBER for 2000, 2001, 2002, 2003, 2004, 2006, 2007, 2010, 2011, 2012, 2013, 2014, 2015, 2017, 2019, 2020, 2021 & 2022 were all UP....

OCTOBER for 2005, 2008, 2009, 2016 ,2018 & 2023 were all DOWN.....

MAY for 2001, 2002, 2003, 2004, 2005, 2007, 2008, 2009, 2014, 2016, 2018, 2019, 2020 & 2021 were all UP.....

MAY for 2000, 2006, 2010, 2011, 2012, 2013, 2015, 2017, 2022 & 2023 were all DOWN.....

Now I need to clarify something about the May/October Theory, it all depends on which school you went to....

Some say that the calculation is "that a particular month is either Up or Down in relation to the previous month" (not really sure what part of the previous months data they would use - High, Low, 1st day, Last day, etc)...

Most Analysts/Brokers say the calculation is "that a particular month is either Up or Down from Close Of Trading on the 1st day of the month to Close Of Trading on the last day of the month...

Others suggest the calculation should be from "the opening price on day one to the closing price on the last day of the month...

The May/Oct Theory dates back to the early to mid 1900's when Company Reporting Rules revolved around the now obsolete March & September Reporting Timetables.....

They are old "Share Trading Rules" that belong to a past era, and as such have outlived their usefulness - Smart Brokers are using scare tactics and misguided fear to make profits at your expense.. WAKE UP AUZZIE..... Savvy Brokers are all about setting you up AGAIN......

When you think about it, it really is a form of Ramping......

All I can suggest is that you must DYOR if you are relying on this OUTDATED THEORY...."

Cheers...
DrB.
Thanks 👍
 
The month of May is here again - I feel it is time to repost this one again.

"Everybody needs to get up to date with “OLD SAYINGS” – They are just that – “USELESS OLD SAYINGS”……The fear everyone has about May & October each year is RIDICULOUS - most are Great Months – Particularly since the year 2000…..

OCTOBER for 2000, 2001, 2002, 2003, 2004, 2006, 2007, 2010, 2011, 2012, 2013, 2014, 2015, 2017, 2019, 2020, 2021 & 2022 were all UP....

OCTOBER for 2005, 2008, 2009, 2016 ,2018 & 2023 were all DOWN.....

MAY for 2001, 2002, 2003, 2004, 2005, 2007, 2008, 2009, 2014, 2016, 2018, 2019, 2020 & 2021 were all UP.....

MAY for 2000, 2006, 2010, 2011, 2012, 2013, 2015, 2017, 2022 & 2023 were all DOWN.....

Now I need to clarify something about the May/October Theory, it all depends on which school you went to....

Some say that the calculation is "that a particular month is either Up or Down in relation to the previous month" (not really sure what part of the previous months data they would use - High, Low, 1st day, Last day, etc)...

Most Analysts/Brokers say the calculation is "that a particular month is either Up or Down from Close Of Trading on the 1st day of the month to Close Of Trading on the last day of the month...

Others suggest the calculation should be from "the opening price on day one to the closing price on the last day of the month...

The May/Oct Theory dates back to the early to mid 1900's when Company Reporting Rules revolved around the now obsolete March & September Reporting Timetables.....

They are old "Share Trading Rules" that belong to a past era, and as such have outlived their usefulness - Smart Brokers are using scare tactics and misguided fear to make profits at your expense.. WAKE UP AUZZIE..... Savvy Brokers are all about setting you up AGAIN......

When you think about it, it really is a form of Ramping......

All I can suggest is that you must DYOR if you are relying on this OUTDATED THEORY...."

Cheers...
DrB.
To deny there is seasonality to markets is short sighted. Our markets generally follow those in the Northern Hemisphere.

I couldn't be bothered searching for indices or stocks in May and just chose BHP over the last 5 years, which is our largest stock by market cap and is traded in both hemispheres. It clearly shows seasonality between May and later in the year.

Ignore wise sayings at your peril.

I also enclose a link to bolster my point.

I am distressed by this maudlin machination to dispute fact.


bhp.png


gg
 
To deny there is seasonality to markets is short sighted. Our markets generally follow those in the Northern Hemisphere.

I couldn't be bothered searching for indices or stocks in May and just chose BHP over the last 5 years, which is our largest stock by market cap and is traded in both hemispheres. It clearly shows seasonality between May and later in the year.

Ignore wise sayings at your peril.

I also enclose a link to bolster my point.

I am distressed by this maudlin machination to dispute fact.


View attachment 176308


gg
@Garpal Gumnut

Think you are assuming way too much in relation to my above post #84 on page 5....

I make NO mention about the “Markets Seasonality”….

I made NO mention of “Ignoring Wise Sayings”…

If you are using BHP as your example, The Months of May for 2019, 2020, 2021, 2022 were great months for BHP, Only May 2023 was down a bit…, So I hope that the “Sell in May practitioners” did their own Research B4 Selling, as there were substantial profits they may have missed out on..

Your link is probably sponsored by a Broker or 2…. And you make no mention of the links stated DRAWBACKS to the Sell in May & Go Away mantra…. Some of those Drawbacks in the “Sell in May” mantra as follows:-

“”The seasonal tendency's averages also conceal big fluctuations from year to year, of course. In any given year, the influence of seasonality is swamped by a variety of other, often more pressing considerations. Selling in May would have done anyone following that adage no good in 2020 as the S&P 500 slumped 34% over five weeks in February and March as the COVID-19 pandemic struck, only to return 12.4% from May to October.

In fact, in the decade through 2020 the unfashionable summer half of the market year averaged a solid if unspectacular return of 3.8%, with no significant decline since 2011, according to LPL Research"".

And you make NO mention of the numerous “Alternatives to 'Sell in May and Go Away' mantra…​

On the other hand, in my post, I did say, “All I can suggest is that you must DYOR if you are relying on this OUTDATED THEORY...."

But I agree with you when you say that you are “distressed by this maudlin machination to dispute fact”… You are ignoring the facts in my post #84 on page 5…. And the facts from within the link you provided…

I could post details on just how the Savvy Brokers use “Wise Sayings” particularly during April each year, but that may be a step too far for me…

Interesting for all Beginners to see the different approach I have as a Contrarian Trader….
 
Here is another Commsuc Clanger for Beginners to watch out for....
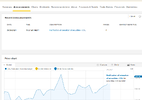
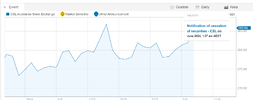
From the Price Chart snapshot below you can see on the "Notification of Cessation of Securities" was received @ 1.37am 5/6/24....
HOWEVER....
We recieve the Announcement @ 11.37am 5/6/24 - Had that announcement been "Market Sensitive" a lot of punters may have been caught out....
Three Cheers for Commsuc .... :thumbsdown: :thumbsdown::thumbsdown:

1717631157384.png
Cheers..
DrB.
 

Attachments

  • 1717631100662.png
    1717631100662.png
    78.8 KB · Views: 0
Here is another Commsuc Clanger for Beginners to watch out for....
From the Price Chart snapshot below you can see on the "Notification of Cessation of Securities" was received @ 1.37am 5/6/24....
HOWEVER....
We recieve the Announcement @ 11.37am 5/6/24 - Had that announcement been "Market Sensitive" a lot of punters may have been caught out....
Three Cheers for Commsuc .... :thumbsdown: :thumbsdown::thumbsdown:

View attachment 178233
Cheers..
DrB.
But is it a Typo ??....
Should the Price Chart Time Notation read 11.37am (like the Announcement) - Very Basic errors that Commsuc NEVER proof read....
 
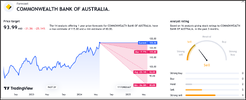
More information for Beginners – All Snapshots are as at Sunday Morning 9/6/24…. I will use CBA as the example stock….
1717905446164.png

The subject this time is - What Do Brokers mean when they say:-

A - “12Mth Price Forecast Average”:-
1717905500409.png

OR

B - “1 year Price Forecast”:-

1717905533850.png

OR

C - Chat Room Valuations
where individuals may suggest the stock has a Value of $120.00+….

OR

D
- People like myself, when I relay analysis like the following:-
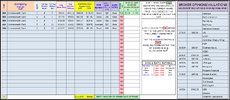
1717905577210.png
Where I quote my calculated Intrinsic Value @ $85.64, which is Based on the Companys Current Balance Sheet Financials and any other Up-to-Date Data that I can locate , and I also relay a separate list of recent Individual Broker Calls that average $91.83 over the past few months….

Examples A, B & C are producing a Guesstimated Future Top Price – Admittedly Broking Houses receive Briefings directly from Companies, the problem with that is that the Broking houses then somehow manage to ‘embellish’ those briefing figures to ridiculous levels, they manage to use words like, "our proprietary model suggests, our proprietary Systems Suggest, we have lifted our FY earnings by 15%, we have lifted our segment volumes by 17%, we expect, we anticipate, we calculate, we project, we predict, etc, etc"......

Each Analyst/Broker has their own versions of 'how to calculate an IV,..... for example – one broker uses a proprietary analytic framework that helps clients uncover value, adjusting for distortions and ambiguities created by local accounting regulations....... It adjusts EPS for one-time events, capitalizes operating leases (where their use is significant), and converts inventory from LIFO costing to a FIFO basis, and also emphasizes the separation of operating performance of a company from its financing for a more complete view of how a company generates earnings.......

Broking Houses can’t be seen to just relay the Co Briefings ‘word for word’ as the Companies quote them – that would render the Brokers Reports as “useless repetition”......


In Example D, my calculations are for an Intrinsic Value - A word of WARNING to the **FA** Newbies - An Intrinsic Value is not a TA call - Intrinsic Value Per Share is not a call on where the Share Price will go to - Intrinsic Value is basically what the company is worth Per Share, based on the company’s published Financial Statements - Basically if the company was ‘wound up’, then each shareholder should get that Intrinsic amount - they would not get the current Share Price.......

An IV can be calculated in numerous different ways – A correct and Valid IV relies a lot on what formulas are used, such as, DCFM, DDM, DDMF, PRESVAL, RIV, IVRR, NROE, CGVI, GIVF, BIVF – and there are numerous others - MAKE SURE YOU UNDERSTAND WHICH FORMULAS ARE BEING USED and what the implications are relating to each formula....

The range of Values in this post highlights the differences…. $120+ down to $80....

Do you use the highest figure of $120+, or do you use the lowest figure of $80, as itemised in this post….

The moral of the story here is that “You must understand the figures you refer to”….


Don’t believe anyone – DYOR….

Cheers..
DrB.

PS- It may help if you look at the DrB FA Help for Beginners Forum, where the subject of Intrinsic Value is explained in more depth....


4/7/24….

I cannot imagine that anyone would use just FA, or just TA, or just FA and TA together for their analysis, Most people need information from every source available….​
Nobody uses FA &/or TA in a way that would Blind them to Everything Else….
Once people understand FA & TA they then realise that Everything Else is reflected back into TA Candlesticks second by second…..​
Brokers get their Original Information from Basic FA, and to a lesser extent, from TA, then they add their Guesstimates such as the following, “our proprietary model suggests, our proprietary Systems Suggest, we have lifted our FY earnings by 15%, we have lifted our segment volumes by 17%, we expect, we anticipate, we calculate, we project, we predict, etc, etc”​
Any other Analysis on a Co's financials usually include some of that Analysts own "Guesstimates" on what the published Financials actually mean - each one uses poetic licence to embellish their own individual publications - Analysts can’t be seen to just relay the Co Briefings ‘word for word’ as the Companies quote them – that would render the Brokers Reports/Analysis as “useless repetition”….​
Most Companies will give their 'calculated guidance for the company going forward', BUT the Analysts Tend to Disagree, so this is where the Analysts try to outguess the company experts - thus we have a guidance from the individual company that most of us accept, and we also have the Analyst/Brokers Guesstimate that is directed toward the beginners and the uneducated.....​
Who cares what the Brokers & Analysts think...... Companies know their businesses better than the Brokers & Analysts....​
Anyone that plays in the "ASX Sandpit" needs to understand that the above is how a lot of unmentionables make their living, unfortunately "off the masses".......​
During the year, and in particular, during Feb & Aug each year, the “The Guesstimate Seasons” begin, Financial Results have been published and digested by all the Experts, where those Expert Broking Houses and Analysts try to Guess what the upcoming Price Targets will be, (& also what next year will produce) for varying Companies.....​
I would suggest Extreme Caution, as history has shown that most of these Guesstimates are WRONG.....​
It's a Game that most Expert Analysts, Broking Houses & Economists play – they are consistently wrong - nearly every year on nearly every stock they "Over Guesstimate Projected Earnings and most other Financials", then when they realise they were wrong yet again, they issue a downgrade within a few months (or Years) that conveniently meets the then current price.....​
Their Inflated Guesstimates continually lead the Newbies up the garden path as they force the prices up, then the same Expert Analyst’s, Broking Houses & Economists do a downgrade, so they can buy when the Newbies have to sell --- SOME OF THESE ANALYSTS ARE REALLY JUST LICENSED RAMPERS --- Grrrrrrrrrrr.​
Admittedly Broking Houses receive Briefings directly from Companies, the problem with that is that the Broking houses then somehow manage to ‘embellish’ those briefing figures to ridiculous levels, they manage to use words like, "our proprietary model suggests, our proprietary Systems Suggest, we have lifted our FY earnings by 15%, we have lifted our segment volumes by 17%, we expect, we anticipate, we calculate, we project, we predict, etc, etc"......​
Each Analyst/Broker has their own versions of 'how to calculate a Target Price,..... for example – one broker uses a proprietary analytic framework that helps clients uncover value, adjusting for distortions and ambiguities created by local accounting regulations....... It adjusts EPS (which is part of the FA) for one-time events, capitalizes operating leases (where their use is significant), and converts inventory from LIFO costing to a FIFO basis, and also emphasizes the separation of operating performance of a company from its financing for a more complete view of how a company generates earnings.......
Broking Houses can’t be seen to just relay the Co Briefings ‘word for word’ as the Companies quote them – that would render the Brokers Reports as “useless repetition”......​
So, Brokers/Analysts use FA & TA plus their own Extras to issue regular Briefings to the Newbies & Uneducated out there – and unfortunately those Newbies & Uneducated follow the publications as if they were correct….
Most of those Briefings are published as compelling "YouTube Videos" purposely designed to lead the uneducated into making rash decisions….
IMO, Brokers Exist only to make you "BROKER"......​
Don’t blindly follow anyone’s Guesstimates, Do Your Own Research.....​
I find that everyone is a Salesman
I prefer to FOLLOW the MONEY
 
Some more general information that may be of assistance to Beginners & Newbies.....
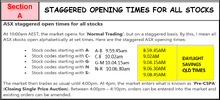
This was a 'Quick Reference Card" that I used many years ago, once I got used to the sequence I stopped referring to it.....
1720998438266.png

This is the ASX web site address....
https://www.asx.com.au/markets/market-resources/trading-hours-calendar/cash-market-trading-hours

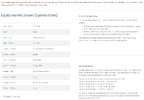
This is a snapshor of the ASX web Page itself....
1720998593718.png

Those Times often help when lodging your "Before Open buy/sell orders" - that is, try not to lodge orders too early or too late....

Cheers..
DrB.
 
Some more general information that may be of assistance to Beginners & Newbies.....
This was a 'Quick Reference Card" that I used many years ago, once I got used to the sequence I stopped referring to it.....
View attachment 180738

This is the ASX web site address....
https://www.asx.com.au/markets/market-resources/trading-hours-calendar/cash-market-trading-hours

This is a snapshor of the ASX web Page itself....
View attachment 180740

Those Times often help when lodging your "Before Open buy/sell orders" - that is, try not to lodge orders too early or too late....

Cheers..
DrB.
actually it was inconsistencies ( of my ISP)during those opening times , that finally convinced me my setup wasn't good enough for active trading ( way back in 2011/2012)

missing out in those vital minutes can be a big deal
 
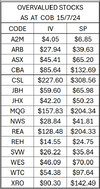
Some more information that beginners may find usefull.....
.OVERVALUED.png
Remember that I quote Intrinsic Values - Brokers quote Target Prices - 2 entirely different outlooks - you must learn the difference....
Read back on this forum to page 5, post #94, and Refer to my other forum - DrB FA Help for Beginners where the subject of Intrinsic Value is explained in more depth....
AND REMEMBER TO DYOR....
Cheers..
DrB.
 
Last edited:
Top