Australian (ASX) Stock Market Forum

DrBourse General Help for Beginners

In this Profession the idea is to Trade when there is a Trade to be made, and even then, you should 'Play the Trade' (like playing a Fish), you should NOT trade the $$$'s - get the trades right and the $$$'s will automatically follow, buying stocks just because you have to 'Make Money' is the wrong reason to buy ... Unfortunately, there are a lot of ppl in that situation - they are usually the ones that get burnt.

One of the problems traders continually have trouble with is, "To Sell, or not to Sell ???" - Traders should as themselves one Question - "If I did not own this stock right now, would I buy it", - If the answer is that you would buy, then you should probably hold - HOWEVER, if the answer is that you would not buy now, then you should probably Sell ASAP...... BUT DYOR.

This is not a game – this is a Profession - it is called share trading not shareholding.
1st paragraph, count me in. Buy to make money.
2nd paragraph...gd tips..shall practise it. Going to write it up to remind moi.?
 
For Newbies and anyone else trying to relate the Overnight DJIA to our "Market or Individual Stocks", here is a method to calculate the ASX200’s rise or fall for the day, it's never perfect, but it is usually pretty close, it's what most of the so called "Experts" use each morning here in OZ........

Use last night’s Dow Jones figure, Divide by 3, then Divide by 2.- SO - IF DOW JONES was UP by 190, then our ASX200 should be UP by about 32, that is, 190 divided by 3 = 63.33, then 63.33 divided by 2 = 31.66......... there are other options to this formula, but I will let the mathematicians of this world show them to us.

SO.......

If BHP was up by $2.41 on the DOW, we would divide $2.41 by 3, then divide again by 2 = 0.4016666c, so our ASX BHP should be up by about 0.40cents.........

There are various ways of calculating/guessing how our Market or Individual Stocks will react to the DOW's results each day, Remember, as there are several other factors involved, it's never perfect, but it is usually pretty close........

Other Factors you need to add in like our Domestic Economic Climate, and our relative Australian problems and Announcements that may occur between the DJIA Closing time, and the End of Our Trading Day, then obtain news of any of those factors that occurred in the "US of A" during their Trading Day..... Not easy accessing all that info, but can be done with the help of some American contacts, in other words I try to get the American version/explanation of What Caused the Rise or Fall....

It's not an EXACT Science, but it usually works for me....
Will try out the calculation on BHP.
Whats your opinion on BHP..how low can it go? My guess around $30.
 
As I’ve mentioned in previous posts, I will visit ASF every so often just to check for any “questions from beginners”.

There is no point in me posting anything new.

Cheers.

DrB.
 
Everybody needs to get up to date with “OLD SAYINGS” – They are just that – “USELESS OLD SAYINGS”……The fear everyone has about May & October each year is RIDICULOUS - most are Great Months – Particularly since the year 2000…..

OCTOBERS for 2000, 2001, 2002, 2003, 2004, 2006, 2007, 2010, 2011, 2012, 2013, 2014, 2015, 2017, 2019, 2020 & 2021were all UP.....

OCTOBERS for 2005, 2008, 2009, 2016 & 2018 were down.....

MAY, 2001, 2002, 2003, 2004, 2005, 2007, 2008, 2009, 2014, 2016, 2018, 2019, 2020 & 2021 were all UP.....

MAY 2006, 2010, 2011, 2012, 2013, 2015, 2017 & 2022 were down.....

Now I need to clarify something about the May/October Theory, it all depends on which school you went to....

Some say that the calculation is "that a particular month is either Up or Down in relation to the previous month" (not really sure what part of the previous months data they would use - High, Low, 1st day, Last day, etc)...

Most Analysts/Brokers say the calculation is "that a particular month is either Up or Down from Close Of Trading on the 1st day of the month to Close Of Trading on the last day of the month...

Others suggest the calculation should be from "the opening price on day one to the closing price on the last day of the month...

The May/Oct Theory dates back to the early to mid 1900's when Company Reporting Rules revolved around the now obsolete March & September Reporting Timetables.....

They are old "Share Trading Rules" that belong to a past era, and as such have outlived their usefulness - Smart Brokers are using scare tactics and misguided fear to make profits at your expense.. WAKE UP AUZZIE..... Savvy Brokers are all about setting you up AGAIN......

When you think about it, it really is a form of Ramping......

All I can suggest is that you must DYOR if you are relying on this OUTDATED THEORY....
 
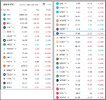
7.30am 7/2/23 - US Mkts have just closed, NEWMONT (NEM) CLOSED down 4.51% - NCM this morning will be interesting - Obviously the Yanks are not happy about Newmonts offer - my bet is for the NCM SP to level out in the ST.......
My ADR & OTC Watchlist is shown below for those that are interested.....
See in this Forum Page 3, Post#33, 8/8/21 for an explanation of ADR's & OTC's....
20230207 ADR & OTC List.jpg
Cheers....
DrB.
 
Last edited:
Another thought for the Beginners & Newbies……

The more you learn about Technical Analysis you will eventually begin to realize that you can, reasonably accurately, call a stocks ST future price action, as I have demonstrated in the Forum “DrBourse TA Help for Beginners” & "DrBourse FA Help for Beginners"……

Having said that, the much harder thing is to attach a TIME to that ST future price action……..

I have been Share Trading for a very long time, and I’m always close to the mark, but never exact……

There are literally hundreds of TA & FA Tools that you can use to help you calculate Future ST Price Action, I have not yet found a Reliable TA Tool for Timing that Future ST Price Action.

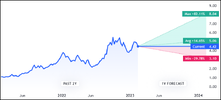
SO, I gave up looking a long time ago. For me, I basically follow a Stocks past history action – I do a lot of backtesting of my chosen stock, I look for a similar scenario from within the past couple of years, to that of today, then I develop a couple of alternate scenarios for my chosen stock, looking at both past price action, past indicator movements, past candle construction & formations, and past company announcements etc. etc.

That is precisely what a lot of professional analysts do, then they come up with something like that employed by Trading View Software – similar to the following example:-
1676604668331.png

Remember that this is not an easy Profession, if it were easy, everybody would be a Share Trading Expert.

Cheers….
DrB
 
Anyone know if, or where there is a link to whatever ebooks are accessable to us within the ASF Site ?
 
Anyone know if, or where there is a link to whatever ebooks are accessable to us within the ASF Site ?

I don't believe there is, but my understanding is that there are only a few at best. Perhaps it is worth starting a thread on free trading or investing eBooks where people can attach or link to free eBooks that others may find useful?
 
I would like to mention that I am copping Agro from quite a few Professionals within the ASX World, people within the industry that I have worked within the past – They seem to think they have a God Given Right to some of the Educational TA that I post.


Most of the Commercially Published TA, and to a lesser extent FA, is aimed at the Beginners & Sheep of this Industry.

Most of the Un-Published TA, and to a lesser extent FA, is tightly held within Industry Ranks of Brokers, Merchant Bankers, etc. etc.

The fact that I often post the Un-Published TA is what the abovementioned Professionals within the ASX World are pizzed off about.


Just because a few ASF Punters have not heard of some of my TA approach to Trading they feel they have to criticize – they feel the need to ‘score points’ at my expense, and their criticism serves to highlight deficiencies in their own approach to Share Trading Analysis.

One Punter went so far as to suggest that I just make everything up as I go – that’s a pretty dumb thing for anyone to say unless they have the knowledge to challenge my posts.

So, I certainly don’t need the “un-educated & irritating flack” that I get from some ASF Punters.

I should just back-off and ignore the knockers – but that’s not my style.

The fact that I continually find the need to justify myself within ASF is annoying and time consuming.

Just wanted to set the record straight for any interested beginners, and remind them to use their own common-sense in relation to my posts.

Cheers..
DrB.
 
One Punter went so far as to suggest that I just make everything up as I go – that’s a pretty dumb thing for anyone to say unless they have the knowledge to challenge my posts.
nope .. that is more my style , and worse still is i resort to it when a sector or the whole market is panicking

i am happy to let you stick to trading strategies

good luck
 
Dealing with members who constantly complain & refuse to accept differing perspectives from their own "can be" a significant source of frustration.

@DrBourse, I completely understand your perspective
It's unfortunate that some members feel the need to criticise & ridicule others in our community. In my opinion, every member should be entitled to express their views without the fear of being ridiculed. In essence, all members should be treated with respect, & personally, I don't feel that's a big ask. By not ridiculing others (even when we disagree) members will feel more comfortable sharing their views & engaging in meaningful discussions.

Ridiculing others serves no purpose & can be counterproductive
When you ridicule others it can cause the other person to become defensive & less open to alternative perspectives.

Ridiculing others is like masturbating in public
"It may feel good to the person doing it, but it's offensive to others"

Skate.
 
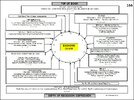
Most people are misinterpreting the “Economic Clock”… It is an “Economic Clock”, It is NOT a “Share Market Clock”… It is an “Economic Indicator”, It is NOT a “Share Market Indicator”… The commonly accepted, 10 year Economic Clock, shows historically what should happen next within the “General Economy of the Country” – but there is no exact time frame attached to the Economic Clock… The Economic Clock gives us an Indication, that we have to interpret, of Economic Conditions within an uncertain timeframe… The Economic Clock and it’s Trends do NOT mean that the Share Market will automatically follow suit… We have to interpret those predicted Economic Conditions, then we have to work out how Individual Stocks are going to react to those Economic Conditions… AN ECONOMIC CLOCK SLOWDOWN DOES NOT AUTOMATICALLY MEAN THAT ALL STOCKMARKET SHARES & INDICIES WILL SLOWDOWN… Some Stocks will slowdown – Some Stocks will gain – Some Indicies will slowdown – Some Indicies will gain…-… The trick here is for us, as Traders, to locate the Stocks we wish to successfully trade.
Just had a look at the Experts Opinions on "What Time is it in on the "Economic Clock right now"....
Google "Economic Clock" for dozens of explanations.....
This link will give you one opinion https://www.rethinkfinancial.com.au/blog/the-economic-clock ......
Remember that the universally accepted timeframe for the Eco Clock is "10 years for each 12 hour cycle"....
Note that some punters feel the 10 year timeframe is "just plain wrong" - I'm in the 10 year cycle group.....
There have been occasions where the timeframe drags out a bit, like during the 1st & 2nd World Wars & the GFC - so Covid 19 may lenghten this current cycle by a couple of years....
My version of the Economic Clock (below) is on page 166.....
Page 166 Economic Clock.JPG
Cheers...
DrB.
 
The month of May is almost upon us - I feel it is time to repost this one again at this time.....

"Everybody needs to get up to date with “OLD SAYINGS” – They are just that – “USELESS OLD SAYINGS”……The fear everyone has about May & October each year is RIDICULOUS - most are Great Months – Particularly since the year 2000…..

OCTOBERS for 2000, 2001, 2002, 2003, 2004, 2006, 2007, 2010, 2011, 2012, 2013, 2014, 2015, 2017, 2019, 2020, 2021 & 2022 were all UP.....

OCTOBERS for 2005, 2008, 2009, 2016 & 2018 were down.....

MAY, 2001, 2002, 2003, 2004, 2005, 2007, 2008, 2009, 2014, 2016, 2018, 2019, 2020 & 2021 were all UP.....

MAY 2006, 2010, 2011, 2012, 2013, 2015, 2017 & 2022 were down.....

Now I need to clarify something about the May/October Theory, it all depends on which school you went to....

Some say that the calculation is "that a particular month is either Up or Down in relation to the previous month" (not really sure what part of the previous months data they would use - High, Low, 1st day, Last day, etc)...

Most Analysts/Brokers say the calculation is "that a particular month is either Up or Down from Close Of Trading on the 1st day of the month to Close Of Trading on the last day of the month...

Others suggest the calculation should be from "the opening price on day one to the closing price on the last day of the month...

The May/Oct Theory dates back to the early to mid 1900's when Company Reporting Rules revolved around the now obsolete March & September Reporting Timetables.....

They are old "Share Trading Rules" that belong to a past era, and as such have outlived their usefulness - Smart Brokers are using scare tactics and misguided fear to make profits at your expense.. WAKE UP AUZZIE..... Savvy Brokers are all about setting you up AGAIN......

When you think about it, it really is a form of Ramping......

All I can suggest is that you must DYOR if you are relying on this OUTDATED THEORY...."

Cheers...
DrB.
Good morning Dr B
I was a wake-up to the brokers doing exactly what you have said here. It was many years ago when i was just starting on the ASX.
Didn't take long to realise I was sending him on an all expenses paid world holiday while I slaved away here at home.
That was the end of my association with him and his ilk.
 
The month of May is almost upon us - I feel it is time to repost this one again at this time.....

"Everybody needs to get up to date with “OLD SAYINGS” – They are just that – “USELESS OLD SAYINGS”……The fear everyone has about May & October each year is RIDICULOUS - most are Great Months – Particularly since the year 2000…..

OCTOBERS for 2000, 2001, 2002, 2003, 2004, 2006, 2007, 2010, 2011, 2012, 2013, 2014, 2015, 2017, 2019, 2020, 2021 & 2022 were all UP.....

OCTOBERS for 2005, 2008, 2009, 2016 & 2018 were down.....

MAY, 2001, 2002, 2003, 2004, 2005, 2007, 2008, 2009, 2014, 2016, 2018, 2019, 2020 & 2021 were all UP.....

MAY 2006, 2010, 2011, 2012, 2013, 2015, 2017 & 2022 were down.....

Now I need to clarify something about the May/October Theory, it all depends on which school you went to....

Some say that the calculation is "that a particular month is either Up or Down in relation to the previous month" (not really sure what part of the previous months data they would use - High, Low, 1st day, Last day, etc)...

Most Analysts/Brokers say the calculation is "that a particular month is either Up or Down from Close Of Trading on the 1st day of the month to Close Of Trading on the last day of the month...

Others suggest the calculation should be from "the opening price on day one to the closing price on the last day of the month...

The May/Oct Theory dates back to the early to mid 1900's when Company Reporting Rules revolved around the now obsolete March & September Reporting Timetables.....

They are old "Share Trading Rules" that belong to a past era, and as such have outlived their usefulness - Smart Brokers are using scare tactics and misguided fear to make profits at your expense.. WAKE UP AUZZIE..... Savvy Brokers are all about setting you up AGAIN......

When you think about it, it really is a form of Ramping......

All I can suggest is that you must DYOR if you are relying on this OUTDATED THEORY...."

Cheers...
DrB.
the ' sell in May ' makes more sense if you are trying to sell at the top of the yearly cycle , i prefer to sell/reduce in a rising market as i get to choose the sell/exit price ( a trader buddy prefers 'at market value ' )
and yes , i am aware that many prefer to sell ( or buy ) after the market signals a top ( or bottom if selling ) has already been confirmed

now in Australia there are some hints that Australian investors/traders do some pre-tax selling ( more likely in June )

quarterly reporting certainty puts a kink in the old system , but in my opinion doesn't break it completely

being a contrarian i quite like buying in May , looking for tax-loss selling of less liquid stocks that still have some investment potential (if i can get a cheap price ) ( the same after Christmas 'cherry-picking' illiquid small caps )

i suggest that investors use some flexibility in styles so they can get the best outcome ( not get washed away in crowd behaviour )

although i don't trade i try to understand the motivations of those who do ( trend and swing traders in particular ) because i am more likely to be the opposite side of the trade , than part of the trend
 
OH ! and if i remember correctly the end of the rhyme is .... and come back St. Leger Day ( a horse race that occurs in the Northern race calendars in mid September ) in time to look for good prices in the October reporting season

i think it important to understand the logic first , and then see if you can tweak it ( or abandon it ) to give yourself a better outcome ( for instance you might be content to hold a stock for years even decades )
 
And for todays Useless Bit of Info......

Here is another Trap for Beginners, it's a pretty obvious one IMO, but its still a problem for the uneducated......

Some Beginners don't really want to learn, they just look for the Easy Stock Pick - well listen up - there is no such animal as "the Easy Stock Pick"......

Just noticed that "MarketIndex/Broker Consensus" published the following gem for unware Newbies......
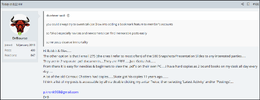
They would have noticed a 721.85% Potential Upside on ARA...... Let's hope the beginners did not just jump in......
Lets hope they dug a little deeper than the average Sheep....

The obvious clue was the "Strong Sell" consensus for a Stock that has a 721.85% 12 Mth Upside.....

The $4.89 12 Mth Price Estimate, maybe should have been $0.489c......

Neat little TYPO there by Market Index - they might need a new Proof Reader IMO.....

20230708 Market Index ARA Typo.png

That example is pretty radical, most are not as obvious as the above....
That was probably just human error - Market Index are normally very reliable IMO, a bit behind in timing of their consensus, but Reliable overall.....

Cheers....
DrB.
 
Top