Australian (ASX) Stock Market Forum

DrBourse General Help for Beginners

Iceberg Order - A large single order that has been divided into smaller lots, usually by the use of an automated program, for the purpose of hiding the actual order quantity. Note, When large participants, such as institutional investors, need to buy and sell large amounts of securities for their portfolios, they can divide their large orders into smaller parts so that the public sees only a small portion of the order at a time--just as the 'tip of the iceberg' is the only visible portion of a huge mass of ice. By hiding its large size, the iceberg order reduces the price movements caused by substantial changes in a stock's supply and demand...
 
Fund Buying & Selling (Cross Trade) can effect a stock by just swapping a holding between several of their own subsidiaries over a period of time - they Buy, Sell, Borrow, Return and Receive shares, over a one month period – they may have some of their subsidiaries showing a loss so to make all of the subsidiaries show a Profit, in a “Smoke n Mirrors” game they basically they need to shuffle stocks between their subsidiaries..... These Trades/Swaps are normally done Outside Normal Trading Hours.....

Let’s assume that Fund Nr 1 is running at a profit and within that fund they bought XYZ for $4.48 on 24/10, let’s say XYZ is now abt $4.72, so there is a profit of 0.24c per share, what they do is to transfer some or all of those shares into a Fund Nr 2 of theirs that is currently showing a Loss, that Fund Nr 2 buys the PRY shares for say $4.64, that gives Fund Nr 1 a 0.10c profit per share, and now Fund Nr 2 who just magically got these PRY shares @ $4.64 each are now also showing a profit as the current share price is still abt $4.72....

Fund Nr 1 was in profit, it still is, but it is just a smaller profit, Fund Nr 2 was in a Loss situation, but now after this magical transfer from Fund Nr 1, we see that Fund Nr 2 is also in PROFIT – all this happens on a daily basis so their individual Fund Subsidiaries NEVER show a LOSS...

But while they are playing Monopoly they are intentionally or unintentionally driving the XYZ share price up or down....

While all this is going on, and in this instance there were a dozen or more Funds involved .. the average Sheep of this world are following the Fund Buying & Selling, that’s OK until the Fund stops, then the Share Price drops pretty quickly leaving a lot of Sheep holding a LOSS.....

There are several variations to that Fundie scenario, sometimes the shares are onsold from Losing Fund into a Profitable Fund at say $5.00 per share, that way the Profitable Fund is just a little bit Less Profitable because they overpaid for the shares, but the Losing Fund magically sold their shares at a ridiculous price, which is great for them because that losing fund is now also in profit......

Hope you can follow all that.....it’s all pretty useless info, but it filled in a bit of time for me :(
 
Force Majeure (French for "greater force") is a common clause in contracts which essentially frees both parties from liability or obligation when an extraordinary event or circumstance beyond the control of the parties, such as war, strike, riot, crime, act of nature (e.g., flooding, earthquake, volcano), prevents one or both parties from fulfilling their obligations under the contract. However, force majeure is not intended to excuse negligence or other malfeasance of a party, as where non-performance is caused by the usual and natural consequences of external forces (e.g., predicted rain stops an outdoor event), or where the intervening circumstances are specifically contemplated.
 
Most people are misinterpreting the “Economic Clock”… It is an “Economic Clock”, It is NOT a “Share Market Clock”… It is an “Economic Indicator”, It is NOT a “Share Market Indicator”… The commonly accepted, 10 year Economic Clock, shows historically what should happen next within the “General Economy of the Country” – but there is no exact time frame attached to the Economic Clock… The Economic Clock gives us an Indication, that we have to interpret, of Economic Conditions within an uncertain timeframe… The Economic Clock and it’s Trends do NOT mean that the Share Market will automatically follow suit… We have to interpret those predicted Economic Conditions, then we have to work out how Individual Stocks are going to react to those Economic Conditions… AN ECONOMIC CLOCK SLOWDOWN DOES NOT AUTOMATICALLY MEAN THAT ALL STOCKMARKET SHARES & INDICIES WILL SLOWDOWN… Some Stocks will slowdown – Some Stocks will gain – Some Indicies will slowdown – Some Indicies will gain…-… The trick here is for us, as Traders, to locate the Stocks we wish to successfully trade.
 

Attachments

  • Page 166 Economic Clock.JPG
    Page 166 Economic Clock.JPG
    130.5 KB · Views: 21
CD=the term B4 dividend is paid where share price usually rises -- XD= EX Dividend, when the price usually drops back by abt the amt of the Dividend – HOWEVER - Stocks DO NOT ALWAYS pullback on their Ex Date - the EX effects different stocks in different ways within different Economic conditions – SO, Don't assume that every stock will always pullback on it's EX Date, and Don’t always presume that every stock will rise immediately after it’s Ex Date pullback……Check the Stock in question and do some research, see what happened on each of the last 5 years Ex Dates and immediately after.... Chances are that history will repeat itself....
 
If a company is Delisted you still own shares in the company. It’s up to you to contact the company to find out what procedures it has put in place for the transfer of shares in that company…..

Delisting is simple. But, if the company not being simply delisted, for example if it is being put into administration or going bankrupt, then you will have to deal with the solicitors in charge of that administration process.

Try these web sites ;-

http://www.delisted.com.au

https://www.asx.com.au
 
I don't agree with people publicly rubbishing one system or the other just because they don't understand the way TA or FA works, then they try to force their own personal preferences onto others, by goading them into comparisons of one sort of analysis over another.... it's an annoying approach that they put forward, and a bit immature..... Once Traders learn how to use TA & FA properly, it is quite easy to take advantage of the "Minor Irritants" that Algo & Option Traders cause, because Algo & Option Traders use TA in a slightly different way than normal, so it easy to exploit their mistakes.....

I am a Technimental Trader (I employ 60% FinA and 40% TA), TA is used worldwide, particularly by Merchant Bankers, Analysts, Brokers, Algo Systems, and millions of others, some cannot understand that fact, and that is just an annoying and uneducated fact of life ..... so, I tend to switch off and ignore them.....

There are numerous “MINOR IRRITANTS” such as Option Traders, Algorithmic Trading, ABC Swing Traders, FTMC Traders, Direct Market Access (DMA), VWAP Strategy, etc that you will encounter on your journey into the Share Trading Sandpit…….

These “MINOR IRRITANTS” can be a huge obstacle to your success, unless you take the time to fully understand how each “MINOR IRRITANT” works and how those devotees all use Technical & Financial Analysis to achieve their goals….. You need to Fully Understand how they work their Magic Tricks……

You must become Expert in Technical & Financial Analysis yourself, so you can take advantage of their shortcomings……

You can take advantage of their actions by using slightly different Indicator parameters (O’Bought, O’Sold Limits & Terms), AND by accepting slightly different Ratio & Margin of Safety expectations (some higher than normal and some lower than normal)…..

Volume is probably the main Technical Analysis Tool that these “Minor Irritant beings” use…..

Unfortunately, most of them don’t even realise that Volume, Volumetric Weight and other forms of Volume Calculation are all TA Indicators……

They also use Weight of Numbers (another TA Tool) to base their actions on, whereas Technical Analysts use other Volume Tools like VWAP Indicators, or the basic Volume Formula in its raw state, or Candlesticks, or any one of several other Volume Based Indicators……

I guess my main point is two fold – One is that New Traders must be Fully Educated, and 2ndly, - Don’t be bullied or intimidated by any of the “Minor Irritant” trading systems…
 
There are always Rumours and Irresponsible Reports appearing on every topic imaginable.. Our task is to listen to those reports then let the Market itself tell us how those reported events are being interpreted….

World & local events will be reflected in our Daily Market, but we can see how those Rumours and Irresponsible Reports effect our market day by day, - I use the XJO (S&P/ASX 200) to see that effect.
 
When Brokers begin to push the "Santa Clause Rally" late each year - Brokers will randomly pick stocks they think they can bluff sheep into buying, stocks that 9 times out of 10 the Brokers wan to sell - they create a mythical ST rally that they can Sell into at the Sheep’s expense.
 
One of the problems traders continually have trouble with is, "To Sell, or not to Sell ???" - Traders should ask themselves one Question - "If I did not own this stock right now, would I buy it", - If the answer is that you would buy, then you should probably hold - HOWEVER, if the answer is that you would not buy now, then you should probably Sell ASAP...... BUT DYOR.
 
A Dead Cat Bounce is a term used by traders in the finance industry to describe a pattern wherein a spectacular decline in the price of a stock is immediately followed by a moderate and temporary rise before resuming its downward movement, with the connotation that the rise was not an indication of improving circumstances in the fundamentals of the stock. It is derived from the notion that "even a dead cat will bounce if it falls from a great height". The phrase has been used on the trading floors for many years. However the earliest recorded use of the phrase dates from 1985 when the Singaporean and Malaysian stock markets bounced back after a hard fall during the recession of that year. The Financial Times reported a stock broker as saying the market rise was a "dead cat bounce". The reasons for such a bounce can be technical, as investors may have standing orders to buy shorted stocks if they fall below a certain level or to cover certain option positions. Once those limits are reached, the buy orders are activated and the sudden rise in demand causes the price of the stock to rise as well. The bounce may also be the result of speculation. Since bounces often occur, traders buy into what they hope is the bottom of the market, expecting a bounce and thus making a quick profit. Thus, the very act of anticipating a bounce can create and magnify it. A market rise after a sharp fall can only really be seen to be a "dead cat bounce" with the benefit of hindsight. If the stock starts to fall again in the following days and weeks, then it is a true dead cat bounce. If the market starts to climb again, it was not a bounce but a real bottom. The phrase has also been used in politics in reference to primary election poll figures for United States presidential elections......

 
I wish more Stock Market Players had the view that they “DO NOT BELIEVE IN WHAT CHARTS SAY”…....

As a Technimental Trader (I rely on 60% Fundamental’s AND 40% Technical’s), I just love the Stock Market Players with the “I DONT BELIEVE CHARTS” philosophy.


They all make my job so much easier – my Bank Balance Applauds them all, as we Technimental, or Technical Traders, benefit from their uneducated outlook on this profession.


Then there is the argument of Financial Analysis vs Technical Analysis - Remember Balance Sheet Financials & Financial Analysis are issued, “As At a certain Date”, so as time progresses it becomes less relevant - but Technical’s & Technical Analysis (which = share price movements) actually reflects CURRENT NEWS, CURRENT ANNOUNCEMENTS, CURRENT VALUES & CURRENT MARKET SENTIMENT - your stock selection should be based on both FA & TA, not one or the other.


TA was created a thousand years ago to help Fundamental Players understand exactly what was happening in the real world of Share Markets - I think it began in Japan & China, then during the Tulip Boom they added some more EASY TO UNDERSTAND INDICATORs & CANDLESTICK info for the Fundamentalists to follow.


We should view the market as an entire entity, a living, throbbing reality that includes fundamentals, technicals, and realities such as news, rumors, seasonal tendencies, common sense observations, and market conditions.... take a smattering of what others may call “fundamentals” along with a pinch of what some call “technical analysis,” and combine them with a spoonful of know-how to succeed in making your living in the markets.


To all the unbelievers out there - PLEASE keep the flag waving :)
 
Introduced to the financial markets in 1927, an American Depositary Receipt (ADR) is a stock that trades in the United States but represents a specified number of shares in a foreign corporation. ADRs are bought and sold on American markets just like regular stocks, and are issued/sponsored in the U.S. by a bank or broker... ADR's were introduced as a result of the complexities involved in buying shares in foreign countries and the difficulties associated with trading at different prices and currency values. For this reason, U.S. banks simply purchase a bulk lot of shares from the company, bundle the shares into groups, and reissues them on either the New York Stock Exchange (NYSE), American Stock Exchange (AMEX) or the Nasdaq. In return, the foreign company must provide detailed financial information to the sponsor bank. The depositary bank sets the ratio of U.S. ADRs per home-country share. This ratio can be anything less than or greater than 1. This is done because the banks wish to price an ADR high enough to show substantial value, yet low enough to make it affordable for individual investors. Most investors try to avoid investing in penny stocks, and many would shy away from a company trading for 50 Russian roubles per share, which equates to US$1.50 per share. As a result, the majority of ADRs range between $10 and $100 per share. If, in the home country, the shares were worth considerably less, then each ADR would represent several real shares......


There are three different types of ADR issues:

• Level 1 - This is the most basic type of ADR where foreign companies either don't qualify or don't wish to have their ADR listed on an exchange. Level 1 ADRs are found on the over-the-counter market and are an easy and inexpensive way to gauge interest for its securities in North America. Level 1 ADRs also have the loosest requirements from the Securities and Exchange Commission (SEC).

• Level 2 - This type of ADR is listed on an exchange or quoted on Nasdaq. Level 2 ADRs have slightly more requirements from the SEC, but they also get higher visibility trading volume.

• Level 3 - The most prestigious of the three, this is when an issuer floats a public offering of ADRs on a U.S. exchange. Level 3 ADRs are able to raise capital and gain substantial visibility in the U.S. financial markets.


The advantages of ADRs are twofold. For individuals, ADRs are an easy and cost-effective way to buy shares in a foreign company. They save money by reducing administration costs and avoiding foreign taxes on each transaction. Foreign entities like ADRs because they get more U.S. exposure, allowing them to tap into the wealthy North American equities markets.


Each ADR's Ups or Downs, plus other factors, all added together gives me a direction for each individual stock and the industry each stock…

Personally, I refer to my ADR List every morning so I can see what happened to our Australian ADR's, getting that information helps my research into just what MIGHT happen with stocks on our ASX.....

I mainly look at the ADR Chart & Candles for Technical Signals at their COB, then relate that candle to what we may expect today - then I look at say the last week or two and compare that trend to our equivalent stock......

Then if needed I will conduct further analysis....

Let's use a mythical stock of XYZ as an example, their ADR (XYZ) atm is Down $0.27USD, or 1.39%, so in theory our XYZ, should reflect that % Drop, BUT then you need to add in our Domestic Economic Climate, and our relative Australian problems and Announcements that may occur between the DJIA Closing time, and the End of Our Trading Day, then obtain news of any of those factors that occurred in the "USA" during their Trading Day..... Not easy accessing all that info, but can be done with the help of some American contacts, in other words I try to get the American version/explanation of What Caused the 1.39% drop....

It's not an EXACT Science, but it usually works for me....

There are DOZENS of other Aussie Stocks listed on numerous other Exchanges, like NYSE, OTC, NASDAQ, Germany, NZ, Sth Africa, Canada, etc, etc....

You can find them all by going to the FREE Web Site - https://www.marketwatch.com

When you get to that site Select "Markets", Then hit the Search Symbol to the right, that gives you a Black Window, where it says "enter a symbol or keyword" you need to try 2 ways, first enter XYZ, then WAIT, DO NOT HIT ENTER, as the search will appear automatically, if that does not produce results, enter "THE FULL COMPANY NAME", that may give the results you are looking for....

Hope you can follow all that....


I would like to point out a minor anomaly - ADR's are usually quoted “in Aussie $$s - the rises and falls are usually against last evening's local USA or UK close" - I prefer to use Bloombergs "Actual Days Trade Figures", they relate to the Days Trade only - so in the USA O'nite if XYZ traded down $1.80 (or 3.07%) during the day, HOWEVER it may have been down 0.57c compared to their yesterdays Close – make sure you understand the diff.
 
For Newbies and anyone else trying to relate the Overnight DJIA to our "Market or Individual Stocks", here is a method to calculate the ASX200’s rise or fall for the day, it's never perfect, but it is usually pretty close, it's what most of the so called "Experts" use each morning here in OZ........

Use last night’s Dow Jones figure, Divide by 3, then Divide by 2.- SO - IF DOW JONES was UP by 190, then our ASX200 should be UP by about 32, that is, 190 divided by 3 = 63.33, then 63.33 divided by 2 = 31.66......... there are other options to this formula, but I will let the mathematicians of this world show them to us.

SO.......

If BHP was up by $2.41 on the DOW, we would divide $2.41 by 3, then divide again by 2 = 0.4016666c, so our ASX BHP should be up by about 0.40cents.........

There are various ways of calculating/guessing how our Market or Individual Stocks will react to the DOW's results each day, Remember, as there are several other factors involved, it's never perfect, but it is usually pretty close........

Other Factors you need to add in like our Domestic Economic Climate, and our relative Australian problems and Announcements that may occur between the DJIA Closing time, and the End of Our Trading Day, then obtain news of any of those factors that occurred in the "US of A" during their Trading Day..... Not easy accessing all that info, but can be done with the help of some American contacts, in other words I try to get the American version/explanation of What Caused the Rise or Fall....

It's not an EXACT Science, but it usually works for me....
 
Dr Bourse, I presume that you are aware that the DJIA is a price weighted index of 30 companies?!

Wouldn't reference to a capital weighted index of 500 companies, (in which some of the ASX200's major constituents also happen to feature), such as the S&P 500, serve as a better reference?
 
But while they are playing Monopoly they are intentionally or unintentionally driving the XYZ share price up or down....
now a tweak to that i spotted years back , is that 'big player ' rents shares out to blur the activity they desire

say they are buying ( carefully ) but lending to short-sellers , and adding in the dips created by the short-sellers ( those skilled option traders would also be aware of other games you can play with borrowed/leveraged shares )

your big player doesn't APPEAR to be driving the share price down , but is certainly accommodating others to do precisely that

obviously a similar tactic can be used as a prelude to a hostile takeover ( or change of control )
 

Data Details​

When companies are removed and added to the index the membership list may temporarily show both the removed company and added company.

Data as of 08/05/2021.

goes to show , i had previously believed they were selected companies weighted by market cap.

cheers and thanks

imagine if the ASX did that .. to say replace the XJO or XTL

DYOR
 
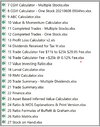
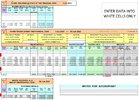
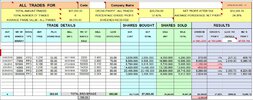
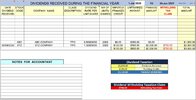
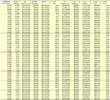
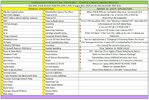
I have 21 Calculators that I have either developed for my own needs, or have developed at the request of other Traders.

They are all just gathering dust, and taking up valuable space here.

The List below summarises Calculators Numbered 7 to 27.

The first 6 are cloned versions of 7 to 27 that I created for my personal use.

1637464951622.jpeg

Happy to send copies to anyone that thinks they can make use of them.

Each one has Comment Box Instructions that are easy to follow.

Anyone interested will need to Direct Message me with your email address.

I will send the lot on one return email, then you can just delete the ones you don’t want.

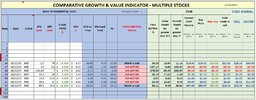
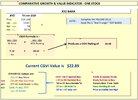
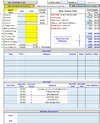
My next 2 posts will show a Shortened Version of each calculator.

Cheers.

DrB
 
7 CGVI Calculator - Multiple Stocks.xlsx

1637465066104.jpeg


8 CGVI Calculator - One Stock.xlsx

1637465090158.jpeg


9 ABC Calculator.xlsx

1637465111405.jpeg


9 ABC Calculator Explanation.xlsx

1637465134347.jpeg


10 Value & Momentum Calculator.xlsx

1637465178796.jpeg


11 Completed Trades - Multiple Stocks.xlsx

1637465199978.jpeg


12 Completed Trades - One Stock.xlsx

1637465222395.jpeg


13 Profit Loss Calculator v2.xls

1637465241534.jpeg


14 Dividends Received for Tax Yr.xlsx

1637465263308.jpeg


15 Trade Calculator Fee $11k to $25k $29.95 Fee.xlsx

1637465287726.jpeg


16 Trade Calculator Fee +$25k @ 0.12% Fee.xlsx

1637465329412.jpeg
 
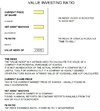
17 Value Investing Ratio.xlsx

1637465402228.jpeg


18 Larval Calculator.xlsx

1637465432389.jpeg


19 RMV Calculator.xlsx

1637465453093.jpeg


20 Trade Summary - Multiple Dividends.xlsx

1637465476228.jpeg


21 Trade Summary.xlsx

1637465494060.jpeg


22 Finance.xlsx

1637465512380.jpeg


23 Asset Based Inferred Value Calculator.xlsx

1637465532453.jpeg


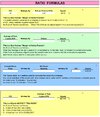
24 Ratio & MOS Explanations & Print Version.xlsx

1637465552936.jpeg


25 Ratio Formulas of Buffett & Graham.xlsx

1637465578360.jpeg


26 Ratio Matrix.xlsx

1637465599228.jpeg


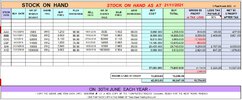
27 Stock on Hand.xlsx

1637465619554.jpeg
 
Top