- Joined
- 25 July 2008
- Posts
- 383
- Reactions
- 5

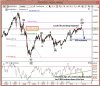
SPI 2 hourly chart. Fib retracement line and stochastic oscillator. Looks to be some bullish divergence close to triggering.
I'm hoping that this concludes an ABC correction to the downside and a resumption of the uptrend. Perhaps the Aussie can jump on the Shanghai coat tails and onwards and upwards?