Re: XAO Analysis
hi N Radge, im newbie to chart.
From your chart here is that means that the major correction will not happen till 24 june?
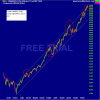
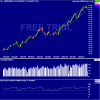
Here is an updated chart but with my seasonal timing dates added in. The horizontal lines are typical seasonal changes in trend and you can see that of late they hold well against the EW counts that I have. Note to the far left that Mar 2 was the start of seasonal strength and also coincided with the significant lows.
Green means seasonal strength coming in
Red means seasonal weakness coming in
Grey means sideways.
We've possibly got a wave-(iii) in place (mentioned a few days ago) which coincides with seasonal weakness starting on or near May 14 and running through to May 21. Therefore I'd be looking at this period as the wave-(iv) decline to unfold down to the support area.

hi N Radge, im newbie to chart.
From your chart here is that means that the major correction will not happen till 24 june?


