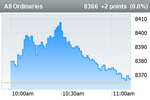
What a strange open to the market this morning. BBOZ didn't know what it wanted, went all over the place. The second half of the market didn't come on for ages. Option expiry day added to the chaos perhaps, and no site had the right spi, except for Westpac who's been stuck on homepage.
You are using an out of date browser. It may not display this or other websites correctly.
You should upgrade or use an alternative browser.
You should upgrade or use an alternative browser.
XAO Banter Thread
- Thread starter clayton4115
- Start date
Dona Ferentes
Pengurus pengatur
- Joined
- 11 January 2016
- Posts
- 16,588
- Reactions
- 22,615
So far, looks like Jack and Jill....let's hope not
Jack and Jill went up the hill to fetch a pail of water Jack fell down and broke his crown And Jill came tumbling after. Up got Jack, and home did trot As fast as he could caper He went to bed and bound his head With vinegar and brown paper.
- Joined
- 12 January 2008
- Posts
- 7,377
- Reactions
- 18,438
Sell the banks, buy dirt. That's some rotation.
Sean K
Moderator
- Joined
- 21 April 2006
- Posts
- 22,392
- Reactions
- 11,783
- Joined
- 12 January 2008
- Posts
- 7,377
- Reactions
- 18,438
I've dipped my toe in the VGS pool. Markets will crash now.
Good, I would like another dip to buy. I've sold more than half of my copper miners after this rally. Sold oil at $77 that I bought at $66.
Need another dip <$70 before buying oil again.
Think we may get a dip as the China stimulus details were very underwhelming. Copper and iron ore should dip. Not seeing many acceptable reward/risk opportunities at the moment.
Last edited:
My, my, I'm so poor at following threads, it's impossible. Just saw Peter's post from mid September. (asking for forgiveness as I'll be absent for another week after today)
Appears the bandaid fell off yesterday, oil and iron ore taken a dive...will go with Peter on that sentiment as per his last post. Good luck everyone.
Appears the bandaid fell off yesterday, oil and iron ore taken a dive...will go with Peter on that sentiment as per his last post. Good luck everyone.
- Joined
- 14 February 2005
- Posts
- 15,347
- Reactions
- 17,679
Which indicator?How reliable are indicators?
None are standalone reliable of themselves.
On investing.com, @Smurf1976Which indicator?
None are standalone reliable of themselves.
Have your cursor over 'markets'. 'Commodities' will drop down under it. Next, have your cursor over 'commodities'. To the far right, click on crude oil and scroll down. A semi circle will show up, the needle is on strong buy still (hasn't changed since this morning) Not sure if this is to be relied on. Having said that, oil is up a tad today. From the same site as shown below:
Crude Oil WTI Futures - Nov 24 (CLX4)
Real-time derivedCurrency in USD
Disclaimer
73.75
+0.18(+0.24%)
Real-time Data00:16:00
- Joined
- 12 January 2008
- Posts
- 7,377
- Reactions
- 18,438
@eskys Most indicators lag the price action. They have to, as they're calculated on known (past) prices. The other parameter to consider is the time period of the indicator. Over what time period is it calculated? It's possible that an indicator can show up on the hourly, down on the daily while up on the weekly.
It's important that traders know the time period that we're trading. Currently on the oil market I'm trading the daily timeframe but I can only trade it long, so I have to wait for the next dip below $70/bbl before looking for my next buy setup.
It's important that traders know the time period that we're trading. Currently on the oil market I'm trading the daily timeframe but I can only trade it long, so I have to wait for the next dip below $70/bbl before looking for my next buy setup.
Thanks, Peter.
I was looking at that real time, and to me that read as 16 minutes past midnight, New York time, I thought.
12 midnight is 00 hundred hours, so 1am is 0100hrs.
PS Not sure if others were trained in hundred hours. For legal matters, we were taught to document in hundred hours in my days.
I was looking at that real time, and to me that read as 16 minutes past midnight, New York time, I thought.
12 midnight is 00 hundred hours, so 1am is 0100hrs.
PS Not sure if others were trained in hundred hours. For legal matters, we were taught to document in hundred hours in my days.
For those who aren't familiar with the 24 hour clock, there's an Autralian version on investing.com.au. I chose the US version so times shown will be reflected as such. (I am assuming that the Australian version won't be in the 24 hour clock)
- Joined
- 12 January 2008
- Posts
- 7,377
- Reactions
- 18,438
IMHO the clock indicators are next to useless. They show the current value only. They don't show the prior movement like a chart. You can't see if the current value is higher or lower than earlier. Useless.
Dona Ferentes
Pengurus pengatur
- Joined
- 11 January 2016
- Posts
- 16,588
- Reactions
- 22,615
Our sharemarket trimmed gains after strong employment data prompted traders to pare back the chance of an early interest rate cut.
The S&P/ASX 200 Index is trading 73 points, or 0.7 per cent, higher at 8363.5 near 12pm after earlier rallying as much as 1.2 per cent to a fresh intraday record.
Investors took some money off the table after the data showed the Australian economy jumped 64,100 jobs seasonally adjusted in September, more than double the market expectation for 25,200. The unemployment rate held steady at a revised 4.1 per cent...
- Joined
- 25 November 2017
- Posts
- 77
- Reactions
- 148
The XAO has been roaring of late and now we enter the Santa Claus rally phase for the remainder of 2024.
I’ve put up below the 20 year chart of the XAO to show the comparison of the most recent steepish bullish rise from late 2023 to present compared to the mid/late 2005 bullish rise leading into the peak mid/late 2007 before the almighty crash which lasted approximately 17-18 months.
Where are we based on the 18.6 year (approx) sharemarket/property cycle?
Definitely fast approaching the final stage …
We have shot through the ‘V’ shape mid cycle correction after markets recovered from the CoVid onslaught in 2020.
There is still a final roaring bullish leg to come in 2025 and very possibly into 2026 based on this cycle.

 realestate.propertysharemarketeconomics.com
This next leg up could well be the best of them all?
We’ll have to wait and see but my projections believe a target of 9100-9250+ XAO is very achievable over the next year give or take …
This bull market is just warming up readying itself for that one final bang, then it’ll be time to run for the hills and find isolation inside the electric fences.
Cash will become the king again!
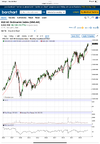
I’ve put up below the 20 year chart of the XAO to show the comparison of the most recent steepish bullish rise from late 2023 to present compared to the mid/late 2005 bullish rise leading into the peak mid/late 2007 before the almighty crash which lasted approximately 17-18 months.
Where are we based on the 18.6 year (approx) sharemarket/property cycle?
Definitely fast approaching the final stage …
We have shot through the ‘V’ shape mid cycle correction after markets recovered from the CoVid onslaught in 2020.
There is still a final roaring bullish leg to come in 2025 and very possibly into 2026 based on this cycle.

Why 18.6 years 18 point 6 – Phil J Anderson | Property Share Market Economics
Hover over clock numbers for cycle details… Why 18.6 years? For over 25 years Phil Anderson has studied economics and markets. And he can say categorically that the Western economies exhibit an 18.6 year real estate cycle.
This next leg up could well be the best of them all?
We’ll have to wait and see but my projections believe a target of 9100-9250+ XAO is very achievable over the next year give or take …
This bull market is just warming up readying itself for that one final bang, then it’ll be time to run for the hills and find isolation inside the electric fences.
Cash will become the king again!

Similar threads
- Replies
- 75
- Views
- 11K
- Replies
- 85
- Views
- 28K

